One of the more significant shifts in the national discussion about criminal legal reform has been the growing acknowledgement that there can be no significant reduction in our prison populations without reforms aimed at how we respond to violence. It has certainly been a point that I have hammered repeatedly over the years. The Bureau of Justice Statistics’ 2020 report on the crimes that people in state prison in 2019 had been convicted of makes the point clearly. Over 58% of all people in state prisons on December 31, 2019, had been convicted of a violent crime, vs. only 14% for drugs–and that understates the importance of violence, since some percent of those convicted of non-violent crimes did so as part of a plea bargain that including dropping violent charges.1

The most consistent push-back I’ve gotten when arguing about the importance of including violence in our discussion of reform is that the one-day, December 31 count will overstate the role of violence in total prison contacts, since people convicted of violence tend to serve longer terms than those convicted of non-violence.
It’s an absolutely fair point! Here’s a simple example to show why it matters. Imagine a state that admits 1 person each year to prison for a violent crime, with a sentence of five years. In the long run, there will be five people serving time for violence (one in his first year, one in his second, and so on). Imagine, too, that the state admits 5 people each year for minor drug and property crimes, and they each serve one year. In the long (and short) run, there will be five of these people in prison each year also (each serving their one year). That’s five people in for violence, and five in for non-violence: half the prison population is serving time for violence! But also? Only ~17% of those admitted to prison are admitted for a violent crime.
A few years back, I looked at this issue specifically in the context of drug offenses, and found that the one-day count of those serving time for drug crimes only somewhat understated the “churn” of people being admitted to prison for drugs (drugs made up ~15% of the population count but ~20% of the admissions). But my focus there was on drugs, not on violence.
So here I want to look at violence more explicitly. And what I see in the NCRP data is that while violent crimes make up about 50% of the prison population one-day counts (although there is a lot of variation across states even for that), they only come to about 30%-40% of the admissions, and only about 30% (or less) of the total number of people passing through prisons.
Separating out churn from populations is thus really important. And these results suggest that we can do more than people like me have argued by focusing on non-violent crimes–although there are still some policy caveats to that claim that I’ll discuss below.
Before digging into these numbers, though, two caveats, which suggests that my results here likely understate the contribution of violent-crime admissions to the total flow of people through prisons.
The first caveat comes from the fact that the NCRP allows me to track people within a state: I can identify that someone who is admitted to prison in New York in 2018 is the same guy who was also admitted for a different crime in 2002.2 In my earlier paper on drug cases, I used this feature to measure the impact of drug crimes on total number of unique people sent to prison. That is certainly part of future work here, but I have not done that yet. If we think that those convicted of violence are less likely to cycle through prison multiple times–if only because they get longer sentences and thus are older at the time of their first release–then estimates of the share of all admissions for violence will understate the share of all unique people who are admitted for violence.3
The second caveat is due to the fact that “violent crime” is a tricky term of legal art. In these graphs, I rely on the federal FBI/BJS definition, which, for example, defines all assaults as violent crimes and all burglaries as property crimes. In many states, however, neither claim is true: some assaults are legally “non-violent,” and some burglaries, like those of a residence at night, are “violent.” In this context, the bias likely means I am, again, understating the role of “violent” crimes as states legally define them: the assaults that are seen as “non-violent” are unlikely to result in prison time, but I bet that a burglary that counts as “violent” is more likely to get a prison term than a “non-violent” one.4 In other words, my current coding practice is much less likely to count as “violent” a crime the state defines as “non-violent” than it is to count as “non-violent” a crime the state defines as “violent.”
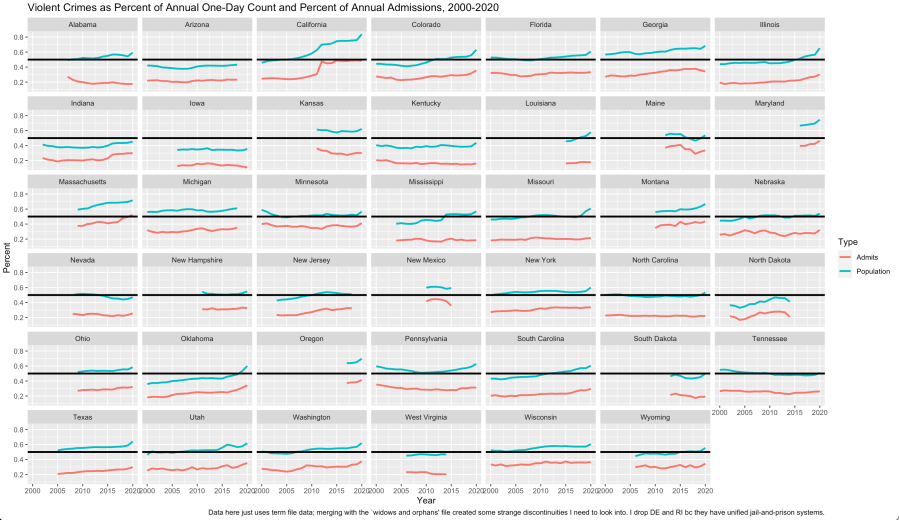
So, the basic churn findings: The following graph plots violent offenses as a share of the December 31 one-day count (the blue line) and as a share of the annual admissions (the red line). Even in the states where over half of all people are serving time for violence, admissions for violence are consistently below 50% (the black horizontal line). The only state where we see anything close to 50% of admissions being for violence is California, and that’s because its aggressive Realignment policy requires a lot of non-violent sentences to be served in county jail (so many such people may still be facing time behind bars, just bars that don’t show up in our prison data).

Another way to look at this is to estimate what share of the cumulative total number of people admitted to a state’s prison entered for a violent crime (again, here, without accounting for whether those admissions are first-time admits or returns–which matters for trying to assess the social and human cost of mass incarceration).5 The next graph shows this. Note that different states have different start periods: for California, the point in 2020 shows the cumulative share of admissions over the period 2000-2020 that are due to violence, but for, say, Texas that 2020 point is just for the period 2005-2020. Given how stable the lines tend to be, I don’t think the starting points (which are determined entirely by data availability) matter that much.6
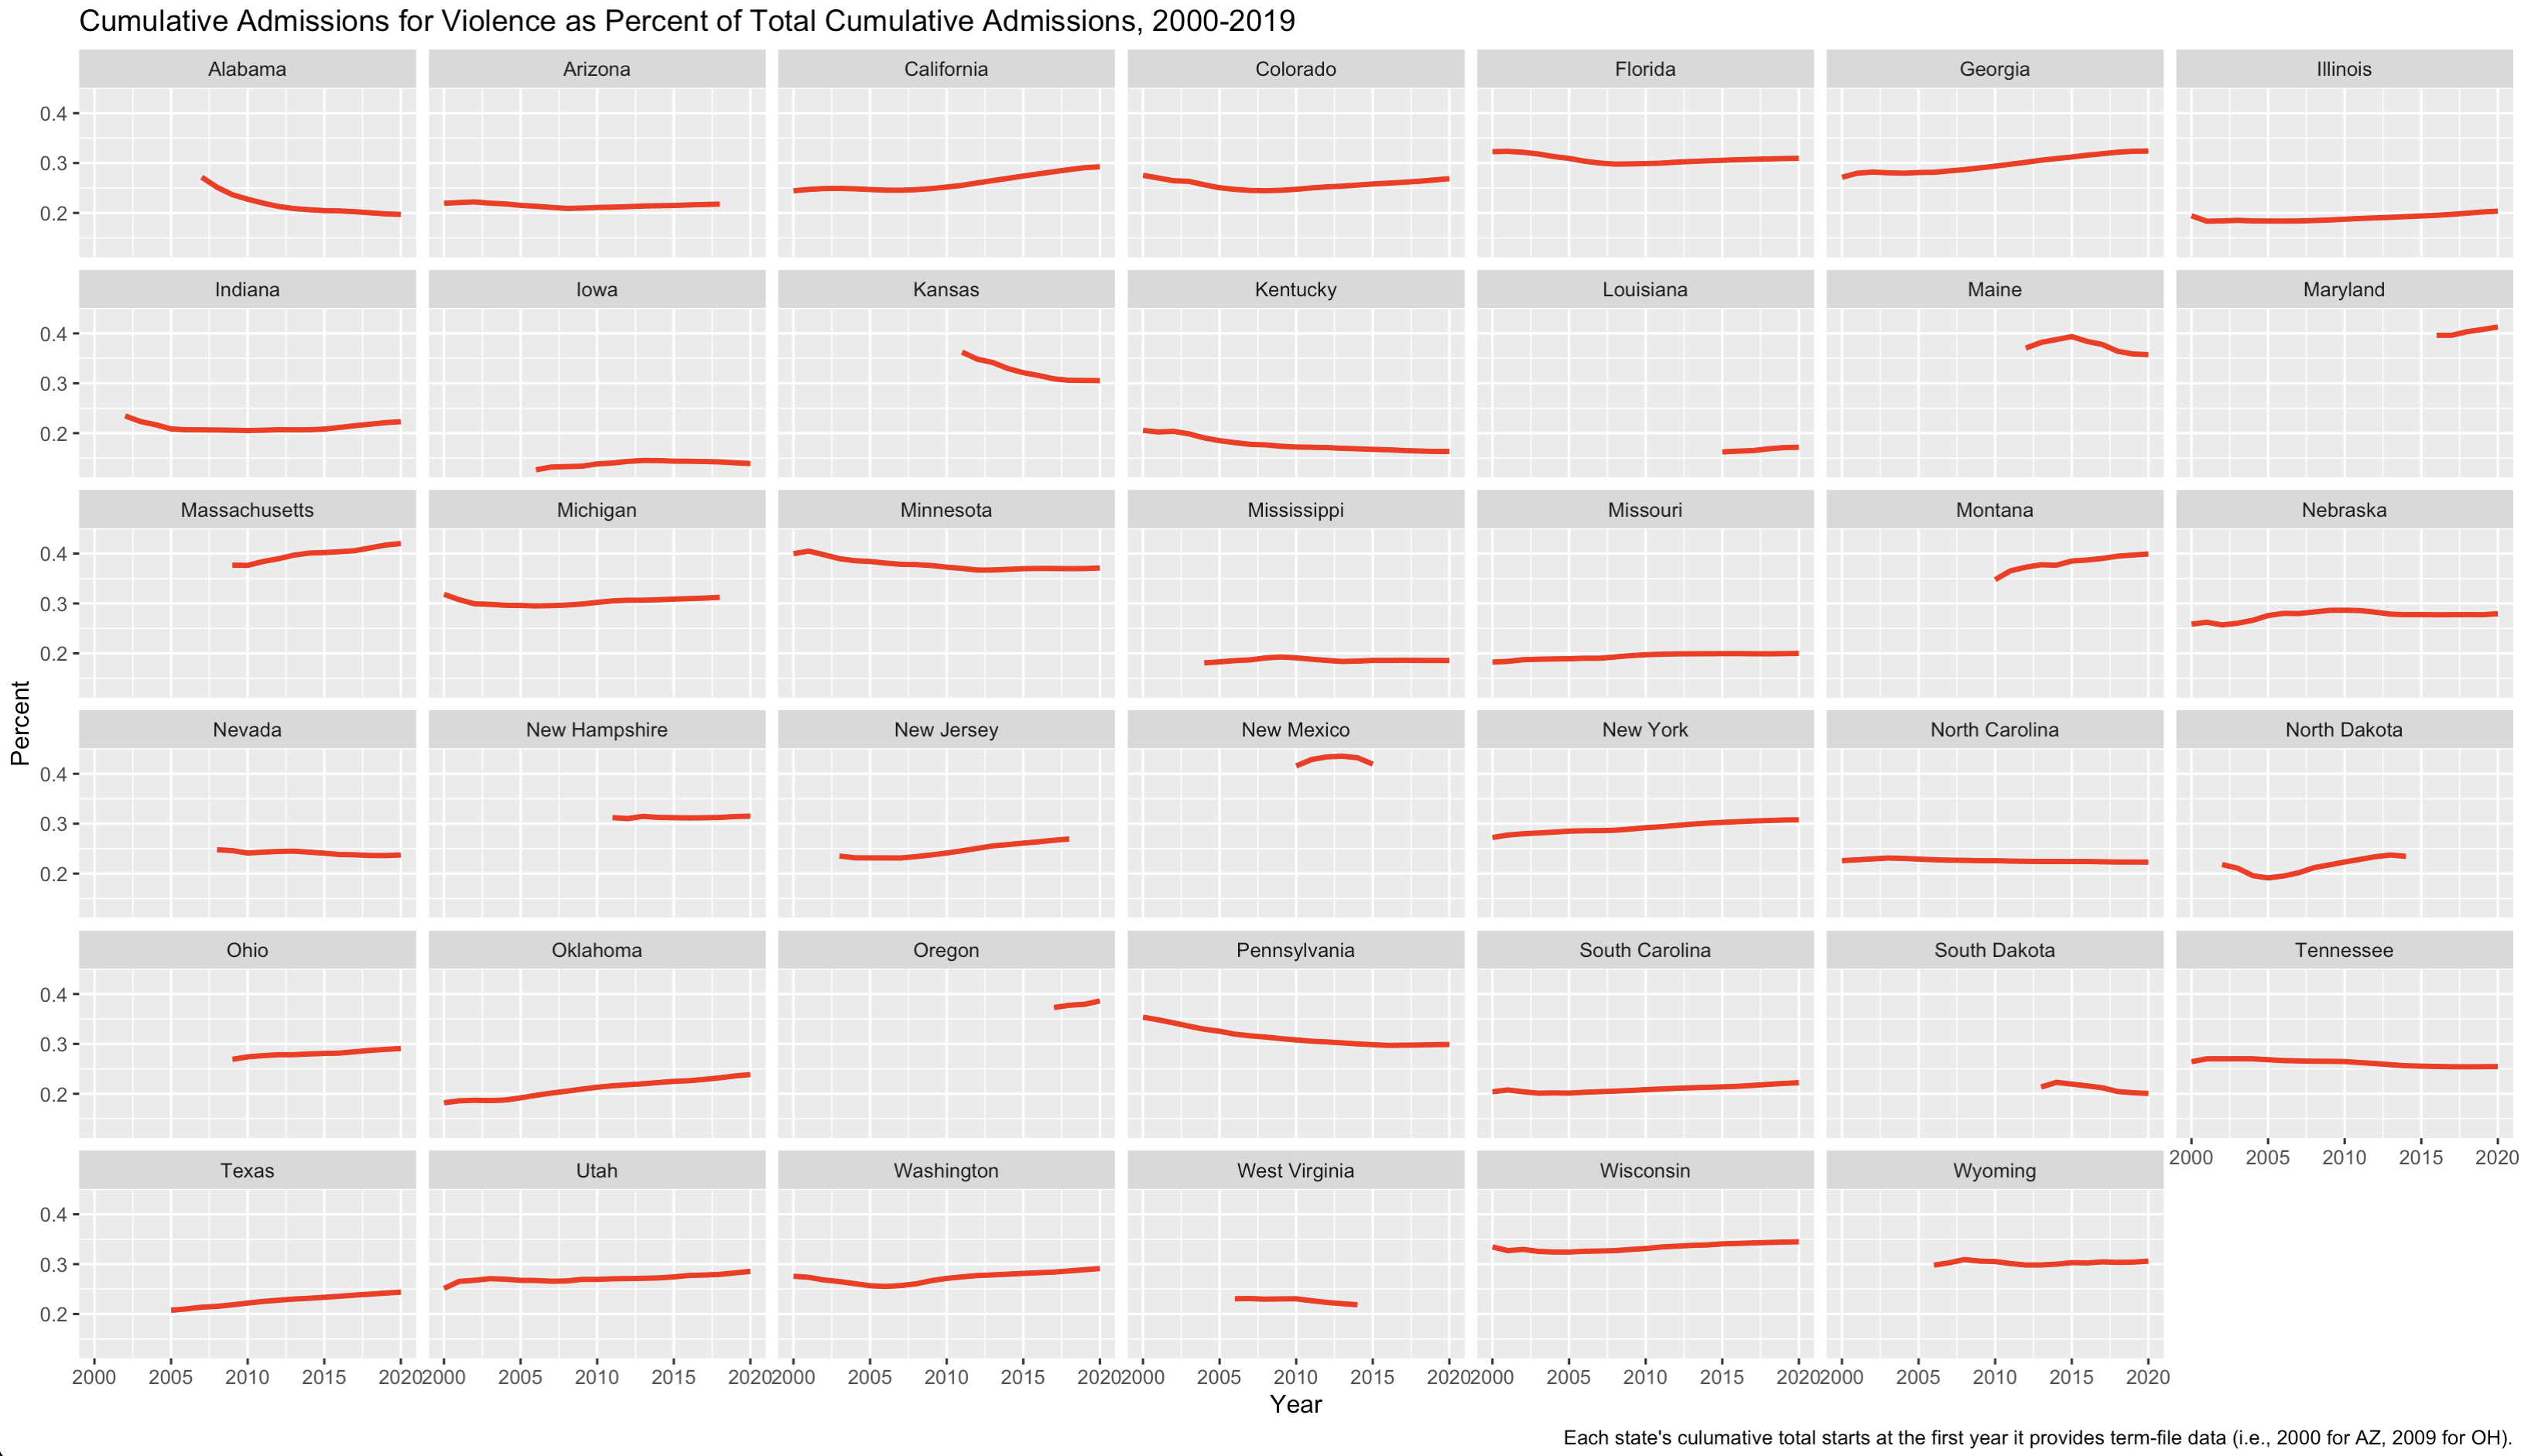
As is clear, subject to the various caveats above, admissions for violence only make up about 30% of total cumulative admissions, at most. In many states, they’re even less than that.
The most obvious policy implication of this is that focusing on non-violent offenses may have the ability to significantly reduce the overall exposure people face to prison, more so than the one-day count data suggests. In fact, this is certainly the case, but with an important policy caveat. Some number of admissions for non-violent crimes are not “really” non-violent cases: they are people who are arrested for a violent act but given the chance to plead out to a non-violent crime. In some of these cases, though, the prosecutors are surely insisting on prison time for the non-violent crime because of the pled-around violent act. If we make it harder to prosecutors to send people to prison for non-violent offenses, they will likely start to insist on pleas to violent crimes for at least some of those cases.
Now, on net, I have to think that making it harder to send people to prison for non-violent cases will lead to a measurable reduction in total exposure (the cumulative admissions number); I don’t think we’d see a one-to-one offset to more plea bargains to violent offenses. But some sort of offset will happen.
Moreover, this is a great example of just what a mess plea bargaining causes makes of our criminal legal data. What formally happens in the data (the thing actually charged, pled to, admitted to prison for) is a quite-imperfect measure of what is actually happening in practice, and so it is hard to use that formal outcome–the thing we have actual data on–to map out how a policy change will play out in practice. But we can at least get a sign on the bias: here, that at least some of the reduction we’d think would come from scaling back incarceration for non-violent crimes will be offset by more demands for pleas to crimes of violence.
Also, while the results here make it clear that focusing on non-violent offenses can do a lot more than we might think to reduce exposure to prison (and a lot more than the one-day count suggests), there are political reasons to also focus on trying to bring down the one-day counts. Many reformers hold a “Field of Nightmares” view of prisons: even in a period of declining prison populations, as long as the capacity remains available, there’s always a risk states will default back to relying more on prisons again.7 And the number of prisons that remain open is a function of daily capacity need. The state DOC, and the state correctional officers’ union, doesn’t care if the 10-bed prison is full because it has five people serving five years and five serving one, or ten people all serving one year. Those have very different churns, but the same capacity demands.
In other words, targeting non-violent offenses cuts back on churn, but has much less impact on capacity demands. Targeting violence does the opposite. Both should be important to reformers, but it is important to note that they can work at cross-purposes if reformers are not careful (by, say, using rhetoric that justifies less severity for non-violent offenses by throwing those convicted of violence under the criminal legal reform bus).
All that said, I want to conclude this post (which is obviously just the first of many to come on the issue of churn and violence-vs-non-violence) by stressing that looking more closely at churn inarguably indicates that policies that target non-violent offenses have the ability to result in bigger reductions in prison exposure than the half-in-for-violence one-day counts suggest. This clearly pushes back against a point I have repeatedly stressed, and it is one whose implications I will be thinking about for a while to come.
Also, more philosophically, these numbers make it clear that when we talk about “prison populations,” we should be a lot more carefully to define what we are talking about: the population of those in prison and the populations flowing through prison are often quite different looking populations, with different policy implications.
.T
- The BJS data runs through 2020, where the role of violence gets even larger, with the share of those in prison on December 31, 2020, convicted of violence rising to over 62% (see Table 16 here). But 2020 is a strange year for prison population data, given the upheavals of 2020, and it’s hard to say now how much reversion to pre-pandemic levels we will see over the next few years’ of data. ↩︎
- Note, though, that the NCRP does not allow me to track someone across states. A person who goes to prison in NJ in 2004 and then in NY in 2016 shows up in the NCRP as two different people with two different state-specific ID numbers, and it is not possible to cobble together a way to link them up. A recent BJS study on recidivism found that ~16% of those who were rearrested were rearrested outside the state from which they had initially been released. Even though only a fraction of those rearrested return to prison, this still means that the NCRP will overstate the number of people experiencing multiple prison terms. ↩︎
- Of course, if you think that those convicted of violence are more likely to cycle through, then the impact of violence on the churn through prisons will be even less than what I show here. Unfortunately, it is not easy (or maybe even possible) to back out an estimate of how the risk of return to prison varies by the earlier conviction offense, so it is hard to give even a back-of-the-envelope sense of things at this point. ↩︎
- The NCRP does include an entry for the state definition of the crime the person in the data was convicted of, but I have not yet dug into how reliable that field is; even worse, as I’ve learned from digging through conviction data in a few states, even the official charged offense may not give you enough details to know if the crime counts as “violent” or “non-violent.” ↩︎
- A prison system that admits 10 people to prison each year for one year terms, releases them, and then immediately rearrests and reincarcerates the same ten people likely does less social harm than a state that has the same policy but the 10 people it locks up each year are different people. The second state does less harm per person but harms more people; my guess is that the social costs of incarceration are non-linear in a way that makes someone’s first time getting locked up more costly than any subsequent lock-up, which would imply that the second state’s approach is the more socially costly. ↩︎
- For those with a deep understanding of the NCRP, I limit myself here to the term file data. I tried to merge in the widow-and-orphan data where it seemed reliable and adjacent to the term data, but for several states the lines made strange jumps at the WO-term transition point. There will definitely be a deep-in-the-methodological-weeds post at some point in the future as I try to figure out how, or even if, it’s okay to merge WO and term-file data. ↩︎
- “If you build it (or keep it open), they (the adults in custody) will come (because the state has beds at the ready that judges and the state DOC will fill).” ↩︎

Pingback: Understanding First-Time Drug Possession Charges in Texas - Texas Dallas Criminal Immigration Lawyer
Pingback: What Does an Immigration Lawyer Do in Dallas? - Texas Dallas Criminal Immigration Lawyer