Early on in my career, I heard a speaker say that one (partial) explanation for the greater levels of punitiveness in the US is that our criminal legal system is too democratically accountable: unlike in many European systems, in the US almost all of those in charge of arrests, prosecutions, and sentencing are either directly elected or (like most but not all parole boards) report to someone who is. So even if the broader European public is similar to the US public in its harsh attitudes towards crimes, Europe’s criminal legal bureaucracy can respond to that harshness less.
In the US, the most crime-policy-accountable official is the local prosecutor, who is the one official elected solely on criminal legal issues. Perhaps surprisingly, however, we know almost nothing about the politics of prosecutorial elections; in fact, there is actually very little empirical work on what drives the election of any sort of local officials, despite the significant roles they play in shaping people’s daily lives. Over the past year, I’ve tried to rectify this when it comes to prosecutors, just by trying to generate some simple but informative descriptive statistics on what these races look like, at the very micro, voting-precinct level. I recently published a few of these results, looking at Chicago, Philly, San Diego, and Allegheny County (for 2019), but in the weeks ahead I plan to post a lot more maps, looking at lot more cities.
As I’ve started work on this project, a common theme has emerged: the support for reform prosecutors tends to be strongest in the areas with higher levels of violence, and are especially strong in communities with higher Black populations.1 This runs contrary to what at least used to be a common conservative push-back against reformers, that they represent the values of relatively unimpacted, low-crime white progressives, who in turn are “inflicting” higher crime rates on poorer, Blacker and browner communities against their will.2 This claim, however, appears to be empirically invalid: those most impacted by crime seem to the ones most likely to push for less-punitive, more-reform prosecutors.
In this post, I want to look at the 2023 election in Allegheny County (Pittsburgh), because it provides a rare single-election rematch. Given how ideologically sorted most cities and counties are, the key election for prosecutors tends to be the primary of whatever party controls the county–which, in areas where reformers have a real shot, tends to the Democratic primary. In Allegheny, though, something interesting happened. In the Democratic primary in May 2023, the county’s public defender, Mark Dugan, defeated the 6-term incumbent, Stephen Zappala, 56% to 44%. But sensing Dugan’s chances of winning the primary, the local Republican party called on its voters to write in Zappala’s name as a Republican, which they did… and which meant that in the general, Dugan and Zappala squared off again. And this time, Zappala eked out a close win, 51% to 49%. And it was the white suburbs that drove the reversal.
The implications of this sort of suburban power reach beyond just Pittsburgh. First, these results demonstrate why reform prosecutors have struggled to win, and will continue to struggle to win, in counties that have “too” many people in their whiter3 suburbs. Almost all reformers have won in urban counties that either don’t have suburbs within their county borders, or where the suburban population is sufficiently small (and sufficiently racially diverse). Allegheny illustrates well just how influential these suburban voters can be–even though they rarely have much interaction with the criminal legal system themselves.
Second, this is more than a descriptive claim about where reformers can win–it is an observation that opponents of reform have started to try to use when shaping policy. Florida, for one, appears to have started to think quite carefully about what this means. Somewhat uniquely, prosecutors in Florida are not elected by county but by “judicial district,” with most districts consisting of several counties aggregated together (though there are a few single-county districts). Republicans have recently started pushing to redraw the maps of these districts; as the results from Allegheny suggest, attaching even a few small Republican-leaning rural counties to an urban one could shift the electorate enough to make it impossible for the urban voters to elect reform prosecutors, even though those prosecutors will do most of their work in those cities.
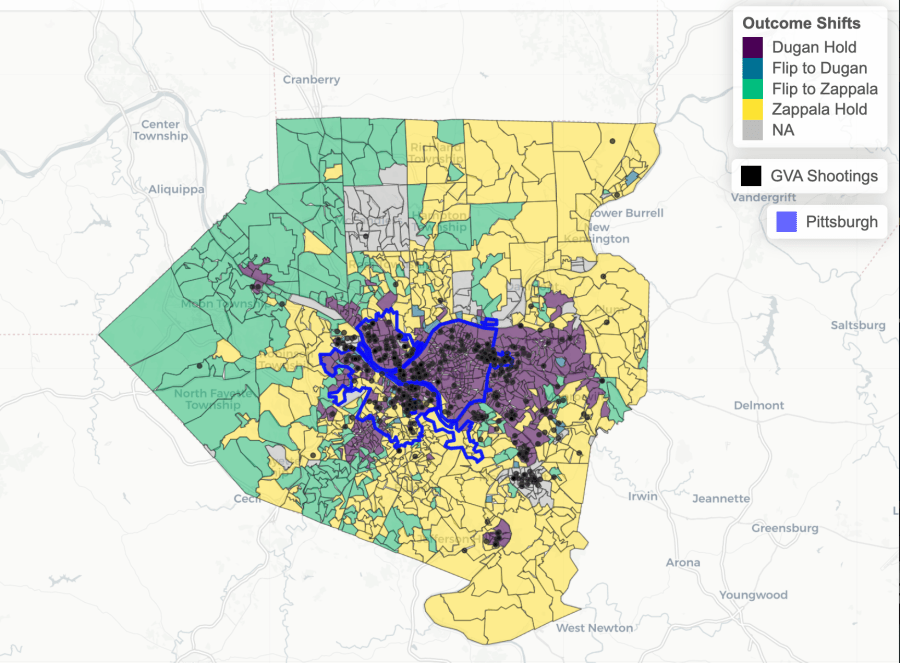
Now, back to Allegheny. This map here tells the main story.

The Black population of Allegheny lives primarily in the city of Pittsburgh and its eastern suburbs–the purple areas that went for Dugan in both the primary and the general. The white eastern suburbs remain consistently opposed to Dugan, and in the western (also quite white) suburbs, it looks like the Democrats favored Dugan but found their votes swamped by Republicans when it came to the general.4
Moreover, the results in Allegheny replicate those seen in many other cities: the areas where gun violence is the greatest are the ones that vote most solidly for the reformers. “Victims” are not, at all, a monolithic group, despite how that term is often bandied about (by reformers and their opponents alike). But it clear that where victimization is the greatest, reformers do the best.5
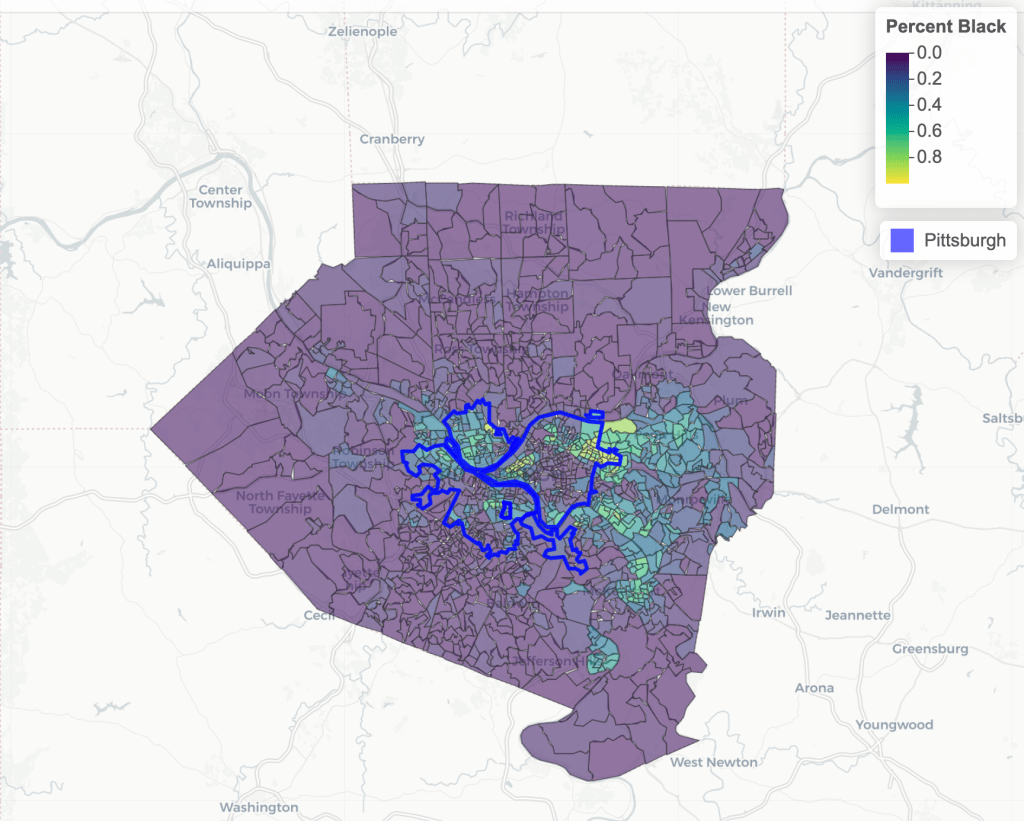
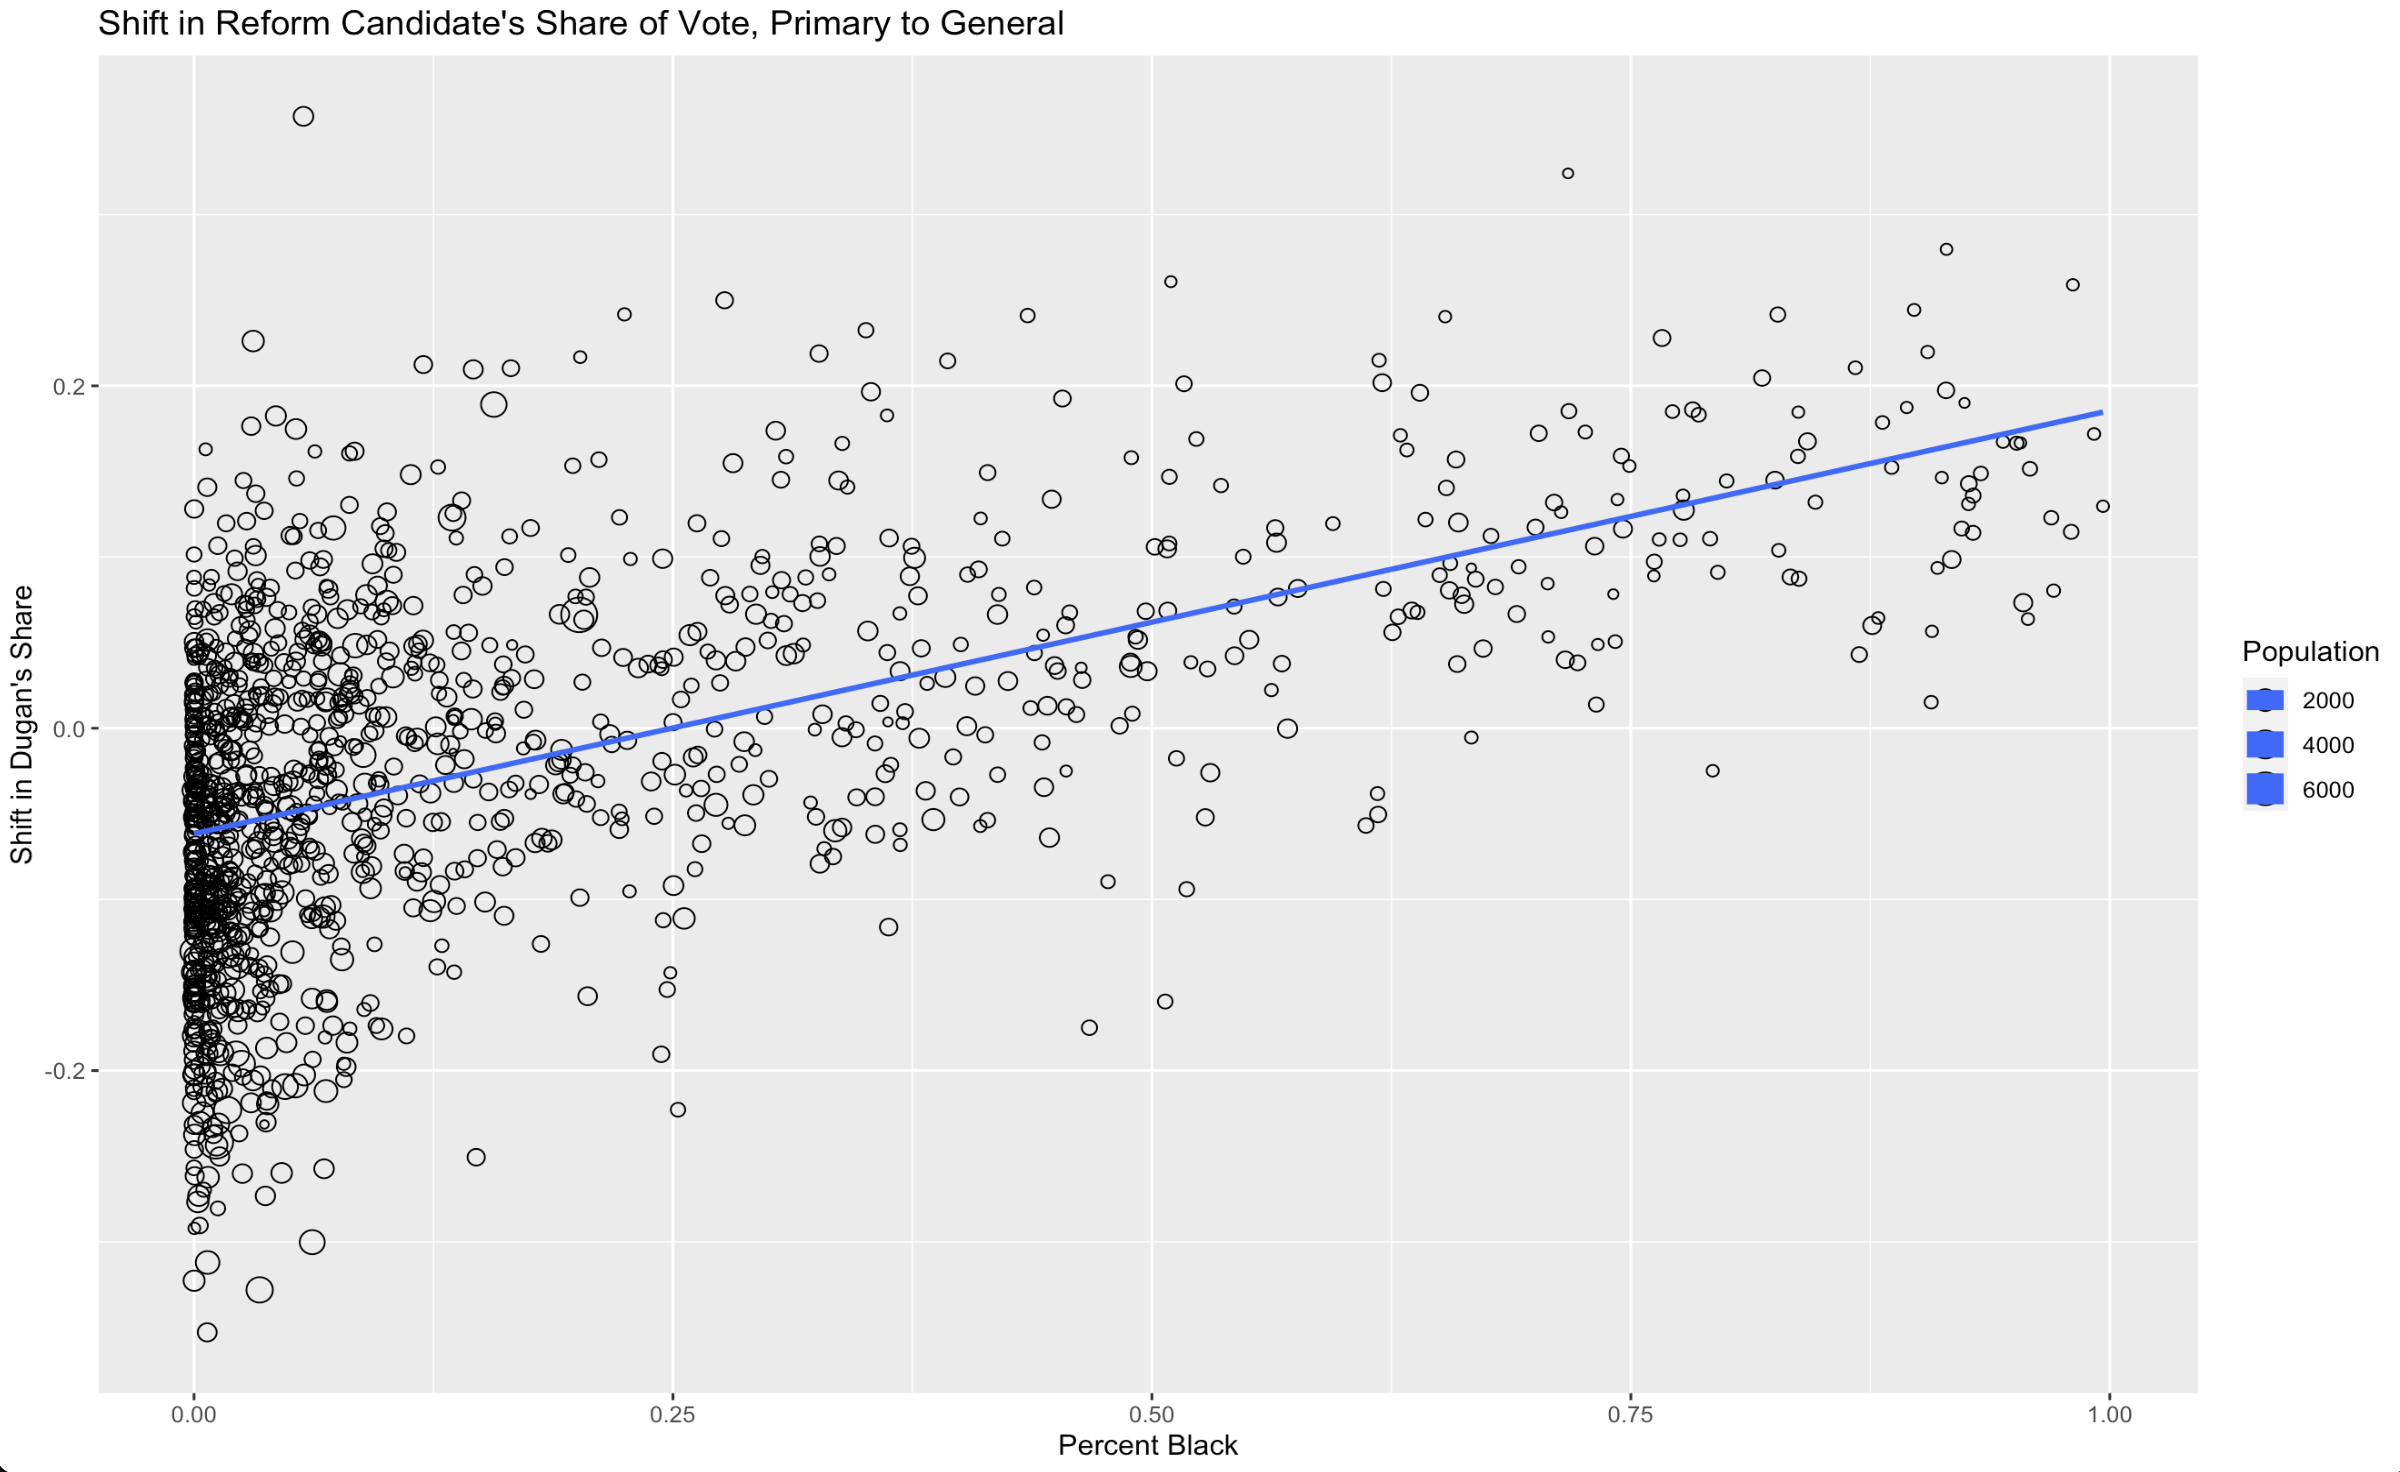
To make the role of race clearer, here are two more figures. The first is just the racial composition of each voting district (measured by percent of the district that is Black).6 Comparing two maps by eye can be hard, so the second figure is a graph plotting how the share of the vote that went to Dugan changed from the primary to the general, plotted against the percent of the precinct that is Black.
First, the map:
And here is the graph showing the primary-to-general shift, by the racial composition of the precinct. The pattern is clear–support for the reformer actually grew from the primary to the general in less-white precincts. (And, I would add, that in almost all the significantly- to majority-Black precincts a majority of voters chose Dugan in the primary, so the shift in Dugan’s share is from a majority to an even bigger majority.)
In short, Allegheny is clear evidence that conservative white suburban voters are the real bane of reformer campaigns. Even when reformers have enough support among suburban Democrats, a sufficiently large bloc of conservative rural voters–voters who are far less exposed to the prosecutor’s policy choices–can thwart the political aims of the urban voters who face the actual implications of what that prosecutor has chosen to do. And Allegheny is a powerful way to see this, because all that changed between the two races is who could vote: the candidates were the same, but the race shifted from closed Dem primary to open general election.
.
- Reformers win in heavily-Hispanic communities as well, but support generally appears to be consistently higher in Black communities. I will have a post about this in the future (I have data from places like Austin and Dallas, which have large Hispanic populations and reform prosecutors), but this is one reason why I generally balk at the use of the term “communities of color,” which homogenizes away important–and, I think, growing–political differences between Black and Hispanic and Asian voters. It is also why I refer to reformers as reform prosecutors, not progressive prosecutors. A recent Pew study suggested that the “Progressive Left” is disproportionately white, and the real political support for reformers comes from impacted Black communities, who consistently vote Democratic but whose ideological views do not necessarily fit neatly within the “progressive” label. ↩︎
- After at least one unpleasant Twitter experience with a prominent tough-on-crime advocate, my sense is that they are now pivoting to claiming instead that low turnout for primaries means that reformers do not have any claim to represent “the people.” Which… yeah, low turnout isn’t great. But I also feel like tough-on-crime types don’t apply that same critical eye to the low-turnout primaries in safe GOP districts that elect the legislators passing tough-on-crime legislation. ↩︎
- Too often, we (and I include myself here) view “white suburbs” as a redundancy: that “suburb” means “white suburbs.” This was true enough in 1990, when suburbs were ~80% non-Hispanic white. But that has dropped to ~56% now, which is actually now slightly below the nation-wide percentage of 59%. And the share of the suburban population that is Black has more than doubled, from 9% to 20%. Allegheny fits this pattern, with a large Black population in its eastern suburbs. ↩︎
- Pennsylvania is a closed-primary state. The election data I have from Allegheny gives me a measure of total registered voters and total voters for each election, but not broken out by party ID. Turnout rose significantly from the primary to the general–it effectively doubled–but it isn’t possible to determine how the increase in voters broke down by party affiliation (i.e., where is a greater turnout among Democrats vs. the influx of GOP voters who couldn’t vote in the primary). ↩︎
- “That’s because criminals like soft-on-crime reformers!” is a trite rebuttal I hear far too often. First, “criminals” is not a static class of people. Second, the number of people who commit crimes with any sort of regularity is too small a number to alter elections. And third, contact with the criminal legal system generally weakens voting behavior, so even if “criminals” were a group (which they generally are not), they are likely one that votes proportionately less, not more, than the local population as a whole (on top of other factors that suggest they’d vote less, like generally being younger). ↩︎
- The weeds of this: I merged Census block-group data from IPUMS into the precinct map. So the demographics of the precinct are just naively-weighted IPUMS data. In other words, assume the population in Block Group 1 is 34% Black and that in Block Group 2 is 43% Black. If Precinct X is 45% in BG1 and 55% in BG2, then I just assume that the share of X that is Black is 0.45*0.34 + 0.55*0.43 = 0.3895. Given how small all these districts are, I figure this is a fair-enough approximation (and anything more refined is impossible). But obviously racial segregation lines in the US can be razor-sharp, which means that assuming the racial distribution of a block group is random across that block group is an assumption, and one that can be wrong in some situations. ↩︎

Pingback: Prosecutorial Elections – Prisons, Prosecutors, and the Politics of Punishment