
One of the more widely-discussed graphs about the politics of crime is the one below from a Gallup report, which is regularly cited for the proposition that Americans’ views on crime are divorced from the actual reality of crime. Now, I’m sympathetic to that view, and there is certainly plenty of evidence that people’s views on crimes are swayed by media coverage which itself can be divorced from the actual reality of crime. But I think the story of this graph is much more nuanced, and much more interesting.

Most people tend to focus on the latter half of this graph, from 2000 onwards, when crime (measured here by the violent crime victimization rate) is low and mostly falling, but large majorities of Americans consistently say that crime is higher year-over-year. Their take is that this reflects a deep ignorance: crime is low, but everyone is afraid. Now, to be fair, this graph raises a bunch of methodological questions,1 but taking it on its own terms its worth looking at both halves of the graph, which seem to me to break into two distinct periods: one of knowledge and one of … something else.
Look first at 1992 to 2000. This is period of the Great Crime Decline, when predictions of ever-rising crime and the pending wave of “super-predators” evaporated before a sustained, and still poorly-understood, decades-long drop in crime. Now, in 1993, those polled were pretty spot on–87% said that crime was rising, and while the violent crime rate technically peaked in 1991, it barely budged over 1992, and those polled in 1993 didn’t yet have access to 1993’s data (which… wasn’t complete yet anyway). As violent and property crime fell steadily over the 1990s, so too did people’s sense of rising crime–each year, as crime kept falling, the percent of Americans saying “crime is rising” fell as well.
This is good! The public was learning. And it shouldn’t surprise us that that learning took some time. Crime is not part of the daily lived experience of most people, so they would not be immediately aware of declining crime, especially in an “if it bleeds it leads” media culture.2
And, during that time, the criminal legal system seemed to be taking notice as well. During the 1990s crime decline, prison population growth slowed as well. The graph below is the annual absolute change in state prison populations, starting in 1979; the grey box corresponds to 1994 to 2001. While prison populations still basically grew each year from 1979 to 2001, over the period of 1994 to 2001 they did so an increasingly slower rate.3 And, in fact, from 2000 to 2001, as crime fell, and as the percent of Americans who acknowledge that crime is not rising hit almost 60%, total state prison populations fell, by the very patriotic number of 1,776.4

But then look what happens as we move into 2002. State prison populations jumped, by nearly 30,000 (and the Feds by an additional 6,500), and the percent of Americans who said that crime is rising soared from 41% to 62%… even as the national crime victimization survey showeds a decline in violence, and the FBI’s Uniform Crime Reports showed a slight decline in overall reported violence as well (although the homicide rate did rise, but by less than one-tenth of one percent).
A huge spike in fear and punishment, clearly unrelated to any actual trend in crime or victimization. And then that fear remained high for the next decade. To me, the story here seems to inescapably be one about September 11th, 2001, and the genuine fear and the politics of exploiting that fear. And this strikes me as the main story because it is consistent with the overarching history of the politics of punishment.
As many scholars have pointed out, the politics of crime and punishment often have little to do with crime trends (or much less than many might expect), and much more to do with broader fears and social anxieties. David Garland, for example, ties the push for mass incarceration to a broader reaction against the civil rights movement, feminism, and other social movements of the 1970s. Bill Stuntz, who links punishment to crime trends more directly, still notes that the politically powerful fear of white suburbanites had less to do with crime itself and more about how the violent protests in places like Watts and Newark changed their views on that crime. And Philip Goodman, Joshua Page, and Michelle Phelps have written a compelling history showing how this pattern persists even as we look back to the early 20th and into the 19th centuries.
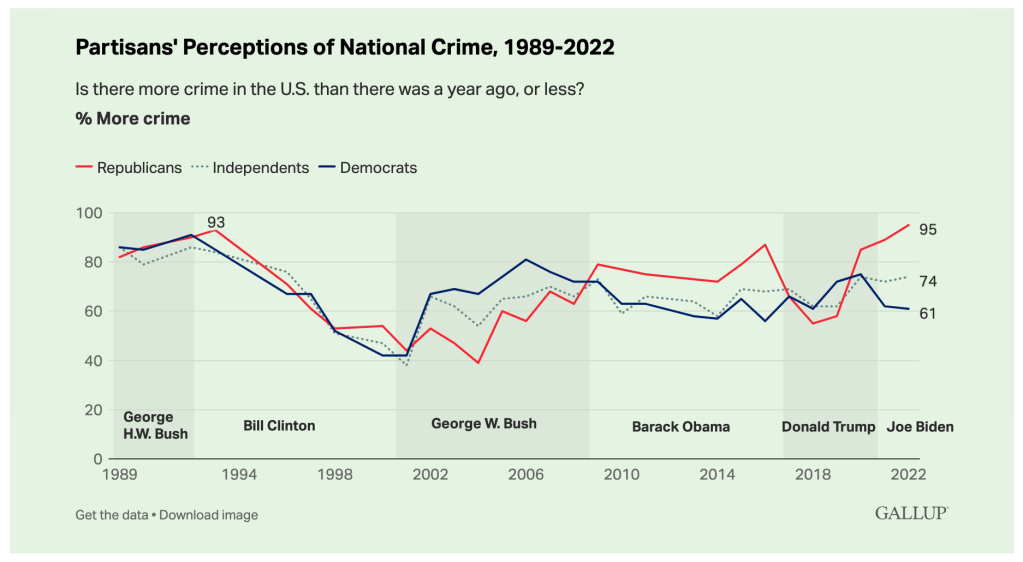
The post-9/11 fears are just another example of this trend–of the politics of punishment really reflecting the politics of broader anxieties, and how we choose to navigate them. To me, here’s another great illustration of this effect: it’s fear of crime, by partisan identification. It’s remarkable to note how the partisans who fear crime more change almost exactly with Presidential power (especially since crime rates themselves are not so respectful of changing administrations, and Presidential policies do little to affect crime in the first place).5 Somehow crime is more likely to rise when your side is out of office–because it’s really more about deeper fears than crime itself.
The one thing that the theory above does not explain, though, is why fear of crime remains high even after the panic from 9/11 starts to wane, and even as the financial crisis of 2008 upended the politics of crime yet again.6 I think the story here is that public perceptions of crime during a period of low stasis are very different than those during the decline itself.
Critics who say high fears of crime in the 2010s reflect ignorance are sort of misreading the poll question. The question is not “are things better now than years before?” It’s “are things better now than ~365 days ago?” During the 1990s, the answer was an unabashed “yes.” One could almost physically feel things get safer. But by the 2000s, the decline had ended and was replaced with crime simply being lower than in the 1980s–but stable. And not always lower than the year before.
A poll in 2005 that asked “do you feel safer now than 20 years ago” and had a lot of “nos” would be concerning. That same poll asking about the year before, though, is somewhat less informative.
In other words, I think the post-2001 numbers are actually hard to understand, because the “right” answer is less clear. But the 1994-2001 trends are a good example of how the politics of punishment are really about the politics of deeper anxieties, which should shape both the possibilities that reformers face and the tactics they should perhaps use.7
dd.
- If nothing else, how do we define “crime is up”? If homicides are down by 10 but robberies up by 15, is “crime” up 5, or do we somehow weigh crimes by severity, so, like, every homicide counts as four robberies, so we think “crime” is “down” by 25? Which crimes do we even include? How do we account for the fact that most people live in low- to no-(reported)-crime neighborhoods and thus get almost all their understanding of crime from the news? Which means are we really measuring perceptions of crime or consumption of local news coverage? Should we use the victimization survey or the official crime statistics, each of which have their own sets of limitations? Not to mention that a “perfect” graph would just ping back and forth from 0 to 100 (0 in years “crime” fell, 100 in years “crime” rose), which means that, for example, in 2010, when crime went down, 66% of people were wrong, but in 2011, when crime went up, that flips to 33% being wrong, because the 67% who said “up” were technically right. But given the high serial correlation in this graph, that can’t be the right way to think about what people are really saying and thus what it means to be “right” or “wrong.” And so on. ↩︎
- But those who did live in or near high-crime communities were certainly aware of the decline, given how substantial it was. I moved to the South Side of Chicago in 1993, and while Hyde Park itself was always fairly safe, it was still impossible not to notice how much things had improved nearby (and in Hyde Park itself) just by the time I finished college in 1997. ↩︎
- As the caption to this graph points out, interpreting a rate-of-change graph can be tricky at first. Any point above zero indicates positive growth. State prison populations, for example, grew by ~80,000 people from 1993 to 1994 (the highest point on the graph, at the start of the gray box), and then by only ~66,000 from 1994 to 1995. So the red line drops, not because total populations drop, but because the change in those populations is dropping. Only when a point is below zero is the overall population falling in absolute value. ↩︎
- Total US prison populations rose, because that same year the federal system–operating under different laws and slightly different politics–rose by over 11,500. The incarceration rate actually did fall, albeit by a barely-perceptible 0.7 points, from 470.26 to 469.55. (The link in that last sentence is there more out of sarcastic annoyance than anything else. The most recent set of updates to the BJS website has actually made it really hard to find the rates data, which should be front and center. The link takes you to its new hiding place, in case that is helpful for anyone.) ↩︎
- The only time the pattern breaks down is 2020, which is of course a year in which all the usual rules for anything and everything went out the window. ↩︎
- This post is basically long enough as it is, so a point for the future is that prison decline in 2010 is almost certainly not unrelated to the financial crisis of 2008, which created a brief and tumultuous alliance between reform-minded Dems and budget-cutting Republicans. ↩︎
- If nothing else, it’s why I am now bearish on fact-checking misstatements about crime trends–those are symptoms of deeper fears, not the drivers of those fears themselves. ↩︎

Pingback: The Democrats Have a Crime Problem. Blame the Media. – niasa
Pingback: The Democrats Have a Crime Problem. Blame the Media. | lofficiel lifestyle
Pingback: The Democrats Have a Crime Problem. Blame the Media. | Billboard Lifestyle
Pingback: The Democrats Have a Crime Problem. Blame the Media. | Vogue US Fashion
Pingback: The Democrats Have a Crime Problem. Blame the Media. | Elle Fashion Magazine