Yesterday the Washington Post had an important, if depressing, article about the rate of sexual violence committed by police against children. Our data on police violence in general is frustratingly sparse and decentralized,1 but scouring the data that is available, the WaPo found that between 2005 and 2022, at least 1,800 officers employed by state or local police departments were arrested for some sort of crime of sexual violence involving children.
That number, however, almost surely understates the magnitude of the problem, for reasons that all our crime statistics are, in many ways, misleading–although the degree of misleadingness here is likely greater than usual. And it’s worth trying to generate some back-of-the-envelope estimates of just how misleading the 1,800 number is.
My goal here, though, is actually two-fold. The first goal is simply to show how our estimates of police violence significantly understate the scope of police violence, and to put those estimates into broader national context. But my second goal is to show more broadly just how hard it can be to use our various estimates of crime correctly: numbers don’t always measure the things they claim to measure, definitions differ across various datasets, and all sorts of traps lurk in the fine print.
A quick tl;dr, though, on the top-level results. Using some incredibly ugly, contestable math, based on data that is a mess to use, I found that the rates of child sex victimization among police (whether resulting in an arrest or not) may simultaneously be way too high, but also less than, or at least close to, the national average. Now, the national average is a generous baseline: those with the duty to serve and protect should be held to a far far higher standard. And the “less than” finding turns on some genuinely debatable assumptions about some completely unmeasurable terms. In other words, there are big error bars here. But I was still surprised that the police numbers were not higher than they were, given my initial gut instinct from the raw values reported by the WaPo.
To start, even that 1,800 number is somewhat tricky to interpret. Only ~60% of the charges involved a defined victim suffering some sort of direct sexual contact, either rape or forcible fondling. CSAM is horrific, but unless a officer himself made it, his role in the victimization is indirect; on-line solicitation could involve a direct child victim, but it could also be the result of a Dateline-style sting. It’s unclear what “other” entails.2
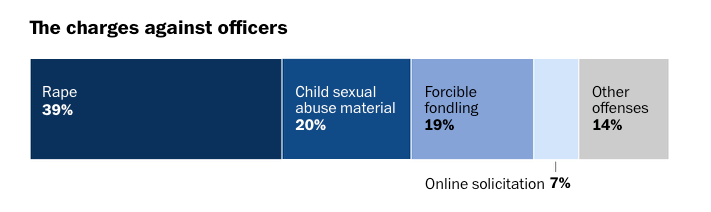
So it could be that the correct baseline number for counting the number of officers who directly assaulted a child is closer to 1,100 than 1,800. Still shocking, but a lot lower–and shows the importance of paying close attention to definitions (which the WaPo did a good job of providing).
How Many Offenses to Get Us To 1,100 Arrests?
My jumping off point here is that we know that the number of cases resulting in arrest is a tip of the iceberg of victimization and offending, just in general. Lots of victims never report their harms to the police, and lots of reported harms are never “cleared” by an arrest.
The naive way to scale up the 1,100 arrests to the likely number of violations would be to use data from the BJS’s National Crime Victimization Survey to see how often the victims of sexual offenses report their crimes to the police, and to use data from the FBI’s Uniform Crime Reports to see what percent of reported sexual offenses are cleared by an arrest. It’s an intuitive approach, and it gives us a decent baseline, but it’s … not quite so simple.
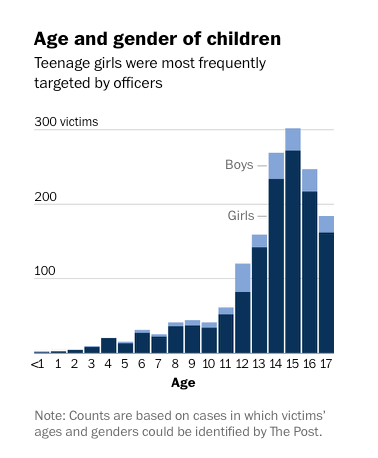
According to the NCVS, victims of sexual assault report their crimes to the police about 20% of the time, although a few times in the late-2010s the rate hit 30% or (just once) 40%.3 Two things to note here, though. First, the NCVS reports victimization rates for a combined “rape/sexual assault” category, without breaking out the two categories, which will pose a problem when we get to arrest rates (which just look at rape). Second, the NCVS reporting rates aren’t entirely on-point here, because the NCVS interviews people 12 and over, and it looks like maybe 10% to 15% of the cases in the WaPo dataset involved children under 12.
If we think younger children are less likely to report their victimization (a 3 year old obviously cannot really at all, so the question can also turn on parental willingness), then the NCVS reporting rates are too high for this study. Even for those over 12, if we think children in general are less willing to report than adults (or fear they are less likely to be believed by their parents or others in authority), the overall NCVS average will skew towards adult reporting rates that are still be too high (even before we bring in the “… and reporting the police to the police” part).
But putting those concerns aside, let’s turn now to the arrest data. The FBI reports that the “clearance” rate for rape offenses–the number of rape cases that result in an arrest–has steadily declined over the 2010s, from ~40% in 2010 to ~33% in 2019 (even accounting for a change in the definition of “rape” over that period).4 But that gives us an average of about 35% or 36% over the time of the WaPo study.
So the simple thing here to do would be just multiply the reporting rate (say, 25% to bias things in favor of reporting) and the clearance rate (say 36% to capture the midpoint), which would give us an offense-to-arrest percentage of 9%, which would mean it would take over 12,000 victimizations to get the reported 1,100 arrests (i.e., if there are 12,000 victimizations, 25% of those would get reported, which is ~3,000 reports, and the police would make arrests in 36% of those, and 36% of 3,000 is ~1,100).
But. The NCVS and the UCR aren’t entirely comparable. The NCVS measures rape + sexual assault, while the UCR reports clearance rates just for rape. It appears that both institutions define “rape” similarly,5 but the combined NCVS term is broader than the UCR’s clearance term. And while there were ~25,000 arrests for rape in 2019, there were ~40,000 arrests for sex offenses other than rape or prostitution, so the part that the UCR omits from its clearance rate is not a trivially small one.
Unfortunately, it isn’t possible to just back out the clearance rate from the offense and arrest numbers. In other words, the FBI provides data on offenses and arrest, but the clearance rate in 2019 for rape is not just arrests-for-rape/reported-rape-offenses (which, for 2019, comes to under 19%, or almost half the official clearance rate). This is because, among other things, a single arrest can clear multiple offenses; it’s a fair point, albeit one vulnerable to abuse.6 So even if the FBI provided offense data for non-rape sexual assaults, which they do not do in the Uniform Crime Reports,7 that isn’t enough to compute the clearance rate.
Do we think the clearance rate for non-rape sex offenses is higher or lower than the rate for rape? I honestly don’t know. My gut instinct is that the less serious the offense, the less likely it is to get cleared, but there’s also a shockingly high number of untested rape kits, so … honestly don’t know.
Now, on top of all this, we have to take into account that we are talking about police officers here. If we think–as seems plausible to me–that people are even less willing to file a report when the attacker is a police officer than a non-officer, then the NCVS reporting rate is too high for our purposes here. Similarly, if we think–as also seems plausible to me–the police are less willing to arrest their own, then the clearance rate is too high as well. But it is impossible to say how big these effects are.
So, where does that leave us? The naive estimator is that these 1,100 assault arrests reflect ~12,000 victimizations. That number gets higher the more we think:
- Children report less often than adults
- Children report against police officers less often
- Sexual assaults are less likely to get cleared than rapes
- Police are less likely to clear allegations against their own officers
So, for example, if you think children are half as likely to report a sex crime committed by an officer than the population as a whole, and the police are half as likely to make an arrest when those reports come in,8 then we get reports in ~13% of cases and arrests in ~18%, which is an offense-to-clearance rate of barely 2%, in which case it would take ~50,000 offenses to get 1,100 arrests.9
Putting That Number in Context
It’s worth thinking about just how bad this number is: how does the rate of offending by police compare to that nationwide? To dig into this, I’ll use 20,000 offenses as my estimate, but it’s easy to see how things look if we assume 12,000 or 50,000 as well. To start, note that the 20,000 offenses will have taken place over 18 years. So that’s 1,111 cases per year. On average, over that time there were ~650,000 to ~750,000 sworn police officers… although the article states that 99% of officers arrested for sex offenses are men, and the number of sworn male officers varied between ~560,000 to ~650,000

1,111 cases per year vs 600,000 male officers comes to an annual rate of 185 per 100,000 male officers. If we limit ourselves just to rape, which made up 39% of the WaPo’s cases, that’s ~700 arrests, which translates into 7,777 offenses using the same 9% offense-to-clearance number. Scaling that proportionately to the 20,000 upscale I used to get the 1,111 rape+sexual offense number, that would suggest the number of rapes would be on the order of 13,000,10 or 722 offenses per year, for a rate of 120 per 100,000 officers.
How to back out a national comparison? A 2002 DOJ report suggests that, analogously to police, perhaps ~99% of rape and sexual assaults are committed by men; I’m not sure how that number has held up over time, but I also struggled to find a newer version of it (but will gladly update this if someone knows of one). That’s the easy part.
Trickier is finding the relevant data for nation-wide offending. The UCR’s rape statistics aren’t appropriate, since they include all alleged rape crimes, and the data here is just looking at children.
One study from 1999 reported that ~285,000 children were victims of sexual assault. At the time, there were ~110,000,000 men aged 15 and older. That translates into an offense rate of ~260 per 100,000 adult men (on the assumption, which I will address, that each person committing such a crime committed only one, at least in that year). This is old data, but at least at the overall level, it’s not clear that rape and sexual violence declined all that much in the following years: nationally, the rate of rape victimization was 32.0 in 2000, and barely budged until the 2010s, when it fell to about 26, then rising again to 30 or so.11 If we think child sexual abuse followed similar trends, then maybe the 1999 survey data (which faces the challenge any survey, especially of violence, faces) is fairly representative for the years that follow.
Limiting ourselves to rape, this suggests that the rate of rape offending by the police is about half that of all US men. What if we raise our estimate of all sex offenses by police officers from 20,000 to 50,000, and thus our estimate of the number of rapes from ~13,000 to ~32,000, or 1,777 per year? Then the annual rate of rape by police officers is just a hair under 300 per 100,000, which is now higher than the national average that I cobbled together.
In other words, a lot turns on exactly how big we think the gaps are from offense to reporting to arrest. At the same time, under some definitely-debatable assumptions, police behavior comes in below national behavior. If nothing else, it is not unambiguously higher.
Note, too, that all the estimates (120 or 300 per 100,000 for police, 260 per 100,000 for all US men) assume that each man who commits a sex offense commits exactly one sex offense. That is almost certainly not true. If we think the distribution of number-of-offenses across men is similar for police and non-police, then the relative rankings here hold. If we think sexual violence is more concentrated in police–if a police officer who commits one sex offense is more likely to commit another than the average man, and that one officer who does not is thus less likely to–then these ratios paint the police in an unfair light. If we think the opposite, then these numbers are unfairly generous to the police.
And, of course, all these comparisons turn on accepting the ugly meatball-surgery math I had to do to get here. There are big error bars around these numbers.
A Brief Aside on Punishment
The WaPo piece notes that of the officers who were convicted, 61% were sentenced to prison, and 15% to time in jail. For the last year we have data, 2006, this is basically the national average for rape and sexual assault: for the combined offenses, if was 64% and 18% for all those convicted in state court.12 Those numbers may seem low, but it doesn’t appear that, given a conviction, officers were receiving all that much more special treatment.

Police Violence and Cost-Benefit Analyses
I want to conclude all this by emphasizing a point I’ve raised before, that our cost-benefit analyses of policing rarely directly address the costs of this sort of police violence. As a general matter, most CBAs of policing take the monetized value of reduced crime as the benefit, and the fiscal costs of enforcement (payroll, etc.) as the costs.
My criticism in the past has been that these estimates fail to account for police violence, such as these sexual assaults or the George Floyd murder. I’ve come to realize that that is not entirely fair. Perhaps police offenses do show up as a cost, or, more accurately, a reduced benefit: each additional crime by a police officer reduces any estimated “reduction in crime.”
But! Three rebuttals to my own revisionism.
First, especially when dealing with shootings, police violence is often not even seen as a crime. Absent cell-phone footage, Floyd’s murder would have not been classified as a crime and would not have entered our data as a crime. This, however, is less of an issue here, since sexual violence is rarely if ever seen as part of an officer’s official duty.
Second, if we think police offenses are less likely to be reported, and less likely to result in an arrest if reported, then our CBA remains skewed. Assume adding one police officer reduces one non-police crime but adds one additional police-officer caused crime. If the officer offense is never reported, but we “see” the reduction in non-officer offenses, then crime appears to fall by one, even if it is really staying flat.
And third, even if we measure officer offending with the same accuracy as non-officer offending, there’s an argument to be made that crimes committed by police are more costly, or should be given more of a weight in our analysis. They may do more objective harm to victims (being assaulted by someone you called to protect you), they may have bigger unmeasurable spillovers (a greater fear of going outside lest another unaccountable police officer harms you), and they may simply be more morally impermissible. But none of our CBAs take these sorts of issues into account.
I think this is enough on this for now. Hopefully this has given some good context, both on police violence in a broader national framework, and just how hard and messy doing these sorts of analyses are.
.
- It’s telling, for example, that the primary databases we have on police shootings are privately gathered, one by the Washington Post, and the other by the Mapping Police Violence project, even though it seems like tracking the violence of its own agents should be a core government responsibility. ↩︎
- Commendably, the WaPo includes a detailed methodology page. But its definition for “other” is just “All other charges are reflected as ‘Other.'” ↩︎
- For 2017 and 2018, see Table 5 here. The data for 2020 and 2021 are here, and 2022 is here. ↩︎
- The FBI does not provide a single easy-to-sue source for looking at clearance rates over time. The FBI’s abysmal “Crime Data Explorer” does not have a useful “clearance” category, and the annual UCRs only provide that year’s estimates. A representative page for the UCR with clearance rates is here; I checked every year from 2010-2019, and they show a near-continuous decline. A likely-small part of the decline is due to a shift in the definition of rape during this period to a more-inclusive definition (which expanded the number of cases more than the number of arrests). But the legacy definition (which the FBI tracked for several years alongside the new definition) also showed fairly steady declines over the early 2010s. ↩︎
- The NCVS defines rape as “Coerced or forced sexual intercourse. Forced sexual intercourse means vaginal, anal, or oral penetration by the offender(s). This category could include incidents where the penetration was from a foreign object such as a bottle. It includes attempted rape, threatened rape, male and female victims, and both heterosexual and same-sex incidents.” The UCR defines rape as “penetration, no matter how slight, of the vagina or anus with any body part or object, or oral penetration by a sex organ of another person, without the consent of the victim. Attempts or assaults to commit rape are also included in the statistics presented here; however, statutory rape and incest are excluded.” The phrasing is not identical, but they seem to track similar if not identical acts. ↩︎
- The logic is clear: even if Bob commits seven crimes, he shows up in our arrest data just once, for the time he gets arrested. (Should he show up seven times, as seven arrests? Should our arrests data track offenses or people? Great questions!) But his arrest does close the books on seven different crimes. Unfortunately, some people have raised concerns that police will sometimes arrest Bob for a completely unrelated crime, then use his arrest to clear a sex offense they think he may have been responsible for as well, even if the evidence is thin and even if Bob is never charged with the offense. There is also a somewhat controversial “clearance by other means” option, which allows the police to classify a crime as “cleared” without an arrest if, say, they believe they know who did it but are unable to arrests him (because, say, he has fled the state or died). ↩︎
- The offense data for offenses other than those published in the UCR are available in the raw data, which is accessible at places like OpenICPSR, but it’s not easy to use the raw data. The official UCR uses some imputation processes to account for under-reporting by agencies (either agencies that do not report at all, or which report only some months a year), so the official number is not just a raw summing up of the numbers filed by individual agencies. ↩︎
- That may not be the case. It could be that the pressure against reporting is so strong that when a report does come in, the case is so egregious that the police feel they cannot ignore it. There’s no reason to assume that the errors in reporting and clearances are uncorrelated, and the direction of the correlation is not immediately clear to me either. ↩︎
- If I were a better coder, I’d create my own “plug in your own probabilities and correlations” slider here, but … I’m not. But if you want to do it by hand, it’s really simple: total offenses = 1,100/(prob-of-report times prob-of-clearance). So 50,000 = 1100/(0.13*0.16) (it’s technically 47,826),. ↩︎
- Again, the math. My 9% estimator suggested that 1,100 arrests needed 12,000 offenses. If we think that the real number of offenses is 20,000, then the offense-to-arrest rate isn’t 9%, but 5.5% (1100/20000). At 5.5%, 700 arrests implies ~13,000 offenses (13000*.055 = ~700). ↩︎
- For those in the weeds of sex offenses, I’m sticking with the “legacy” definition here to keep comparisons consistent. ↩︎
- Data so old it can vote, and almost drink. The frustrating world in which I operate. ↩︎
