
In the early 2010s, as US prison populations were starting to decline, there was some chatter that this time it was different, that this time it was a genuinely bipartisan effort. Groups like Right on Crime gained national attention, and conferences brought together people like Cory Booker and Newt Gingrich to argue for reforms. I even once found myself speaking at a strange conference on reform held at Berkeley Law but hosted by the then-not-quite-as-radicalized Heritage Foundation (which now detests reformers).1 Even places like the Brennan Center held up Texas as a model for the rest of the country to follow.
Now, with hindsight, it is clear that whatever bipartisanship existed was collapsing even before Trump’s “Carnage in America” inaugural speech, and the feverish turmoil of 2020–the George Floyd protests in particular–dealt the fait accompli to whatever of it had lasted that long. But I still wanted to see if there was something to the claim of bipartisan efforts (or, if I’m being honest, I wanted to actually test my skepticism that conservative areas had done much).
Now, to be fair, at the state level the decline was fairly bipartisan. Looking at total declines from 2009-2019, the third, fourth, and fifth biggest drops were in Texas, Louisiana, and Florida, all deep red at the state level. South Carolina was 12th, Missouri was 13th, Mississippi was 15th and Georgia was 18th. Lots of conservative states saw big declines.

At the same time, just because a state is strongly conservative does not mean all of its parts are. After all, the entire current preemption push is an effort by state legislators in red states to thwart the local autonomy of their often-quite-dark-blue cities. So it could still be that decarceration was still mostly a Democratic endeavor, even within Republican states.
And that appears to be exactly the story. I want to start by looking at aggregate national data. Well, national-ish. To look at incarceration at any level below of that of the state (here, the county), I have to use the National Corrections Reporting Program–an incredibly powerful person-level dataset, but one with incomplete reporting due to lots of states dropping the ball. So here I have 26 states, which hold ~75% of the US prison population during this time.2 It’s not a perfectly random sample, and it skews towards severity: while the total US prison population dropped by ~10% from 2009-19, the states in my NCRP sample saw a net ~5% drop. But these states still tells a convincing story.
This first table breaks out trends in county-level prison population along two margins: urbanness and liberalness. The US has two dominant measures of urbanness: a nine-tier scale developed by the USDA, and a six-tier one by the NCHS. I use the more granular USDA scale here. I then measure how “Democratic” a county is by taking the average of that county’s vote for President between 2008 and 2020. I’m sure there are other ways to measure left-leaningness, but this seemed like a reasonable one, and one that is fairly easy to generate.
Here are the core results. Overall, Democratic-leaning counties in my states accounted for ~90% of the net decline. If we just look at those categories of counties that saw declines (i.e., drop all the smaller GOP counties that saw prison populations rise), Democratic counties were responsible for ~85% of the gross decline. The largest urban Democratic counties alone were the source of over three-fourths of the net decline, despite holding only ~40% of the people in prison in 2009.

Now, as soon as I made this table, I realized it may have been a bit unfair to the GOP. As the graph at the top makes clear, California played an outsized role in driving down prison populations, and California is a deep-blue state. Maybe that meant that including it stacked the deck in the Democrats’ favor.
So I dropped California… and to my surprise things got even worse for the GOP. In the aggregate, prison populations grew in GOP counties, although they did still decline in the largest two categories of counties. In other words, most the prison-reduction in GOP counties were in California GOP counties (because of the statewide inescapability of California’s Realignment reform).3
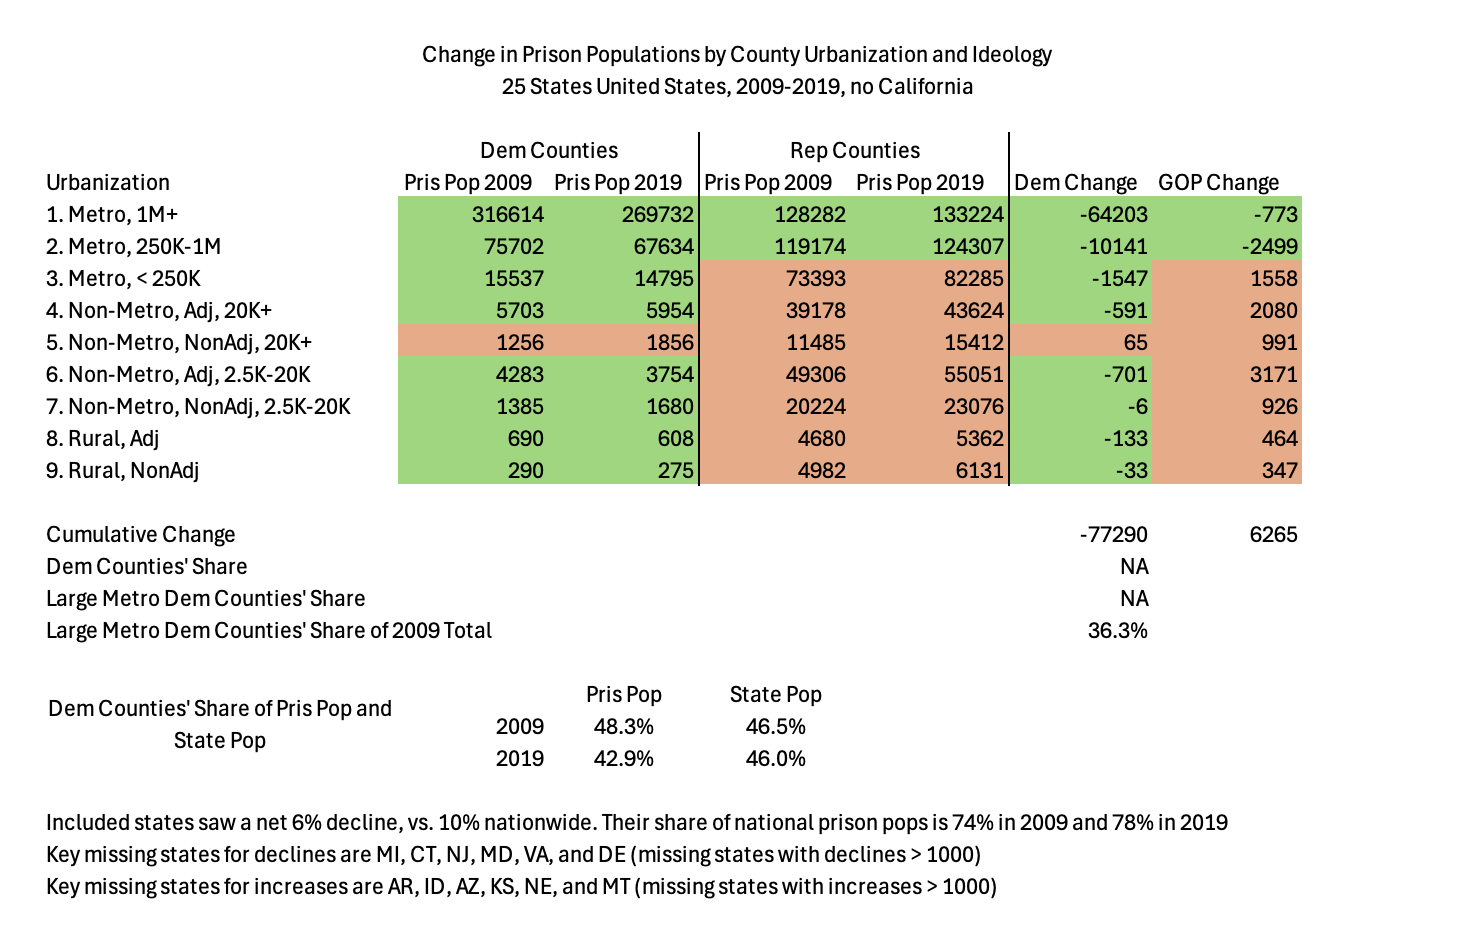
If we look just at the counties with declines, Democratic counties explain ~96% of that gross drop. For the net drop, the percent doesn’t even make sense (it’s 109% of the net total). Essentially entirely a Democratic phenomenon.
And, to be clear, this pattern holds even if we zoom in just those states that were solidly Republican, and just those states that saw declines over 2009-19. Here, I define a state’s “Republicanness” by how consistently the state lower legislative chamber was controlled by the GOP, where “solid Republican” means that the GOP had a majority in either 9 or 10 years of the 2010s.4 I use state representation more than, say, state vote for POTUS to capture the fact that state legislative control determines who sets state-level policy, and gerrymandering, etc., mean that state-level votes do not necessarily translate perfectly into legislative power.
Here I ran into a little bit of a data snag, however. Two solidly Republican states that saw their prison populations drop were Georgia and Tennessee… at least according to the official BJS data. But in the NCRP data, their prison populations rose slightly. Sadly, this is just due to these datasets being noisy and messy. In the case of Tennessee, the decline was sufficiently small–a drop of ~2%, or ~600 from a baseline of ~27,000–that it doesn’t take much noisiness to flip things around. Georgia was a bit more surprising, since its decline of ~2,000 (or ~4% of its baseline of ~57,000) is harder to understand as just noise, and points to some sort of error in the data.
So I present two sets of results here. The first excludes Georgia and Tennessee, and just includes Alabama, Florida, Indiana, Missouri, North Carolina, Ohio, Pennsylvania, South Carolina, and Texas. The second then adds in Georgia and Tennessee in the name of including more states, but which may stack the deck a little against the GOP, given I am including under “declining states” states whose populations (incorrectly, I believe) rose in the data I’m using.
Here are the results without Georgia and Tennessee. tl;dr? In the aggregate, the Democratic counties are doing all the work, even in the Republican states that saw declines. At a more granular level, the same pattern roughly holds, although in both Carolinas a lot more GOP counties see declines as well (especially in South Carolina, the changes do look a lot more like they came from top-down changes as opposed to local ones).5

And here are the results including Georgia and Tennessee. As noted above, given that these states have net gains in the NCRP vs net losses in the BJS count, they may be biased against GOP counties … but then again maybe not, if the “excess” prison population in the NCRP data comes disproportionately from Democratic-leaning counties (which is impossible to check, since the BJS data is state-level, not county-level). But consistent with everything else I’ve shown here, these results point to Democratic-leaning counties as doing a lion’s share of the work.

If I wanted to summarize this post, I think I’d make two points: (1) the main drivers of prison populations, certainly decarceration, appear to be at the local level, and (2) when thinking about the politics of punishment, the politics of those local places matter far more than the states they are in.6
.
- It was a really strange event. After slowly losing it listening to a lunchtime keynote by former NYPD commissioner Bernie Kerik, in which he argued that his adopted Asian daughters had lived purely race-blind lives until the Obama Admin racialized everything, I more-or-less pulled a Khrushchev-pounding-his-shoe-at-the-UN during my session, when a two-time former US Attorney for some part of California started just making up claims about rising crime (I didn’t use my shoe, but I did pound the table when trying vainly to defend reality). ↩︎
- These states are Alabama, California, Colorado, Florida, Georgia, Illinois, Indiana, Iowa, Kentucky, Massachusetts, Minnesota, Missouri, New York, Nevada, North Carolina, Ohio, Oklahoma, Pennsylvania, Rhode Island, South Carolina, Tennessee, Texas, Utah, Washington, Wisconsin, and Wyoming. ↩︎
- There’s a giant gap in the Realignment data: it’s hard to see how much of the prison reduction was offset by new jails admissions (for why this can happen under Realignment, see this). If GOP-leaning counties were more likely to substitute jail for prison than their Democratic-leaning neighbors, then the first table oversells GOP reductions as well, even for California. ↩︎
- As a general matter, the percent of house seats held by the GOP tracks the percent of Senate seats held by the GOP in 1-to-1 lockstep. Obviously, I could have also taken into account, say, trifectas and the party of the governor, and may do so in the future. But I feel like this is a good first rough cut. ↩︎
- And yes, I know that SC adopted some state-level reforms during this time. But lots of states did things at the state legislative level, but that does not mean they translated into state-wide changes. South Carolina, though, seems to be a place where they likely did. At some point, I may want to try to dig into why. ↩︎
- This is why I’ve always disliked, say, that Third Way report on crime in red states. Yes, crime seems worse in red states, but it tends to be higher in the bluer parts of those red states. Maybe some red state policies–like those limiting gun control laws, or rejecting Medicaid Expansion–can matter, but I think it is always important to keep our focus on the local, not the state, and definitely not the national. ↩︎
