
In early August, the Major Cities Chiefs Association released its annual midyear crime report for 2024 to little to no fanfare (I didn’t even see a press release posted on their website). The lack of hype is surprising, because the statistics are dramatic. Compared to the first half of 2023, homicides in the first half of 2024 are down 17%. If that holds to year-end, it’ll be the single biggest homicide decline since at least 1960; even if the decline is half that, 2024 is poised to cap off a three-year decline that will completely eliminate the entire 2020-21 Covid homicide spike (and then some).
Here, I want to dig into the weeds of the MCCA data a bit, because any effort to extrapolate the mid-year results from 69 police departments to the year-end national tally from the 18,000 or so departments nationwide should be viewed with substantial skepticism. Temple’s Jerry Ratcliffe, for example, demonstrated several years ago that the year-end data for the Philly police often differed from the mid-year results to a significant degree.
Perhaps surprisingly, two things appear to hold with the MCCA data: (1) at least for homicides, the direction of the midyear data consistently predicts the direction of the yearend data, and (2) the yearend MCCA data does an excellent job tracking the yearend national data from the FBI. Now, the MCCA data has some flaws to it, especially at more granular levels, and I’ll briefly touch on those at the end, but tl;dr? Midyear MCCA homicide data seems like a solid predictor of yearend FBI national data.1 And the midyear MCCA results for 2024 are remarkable.
The Apparent Predictive Power of Midyear MCCA Data
The MCCA has provided year-end crime data from ~70 departments every year since 2014, but it only started providing midyear data in 2020 (comparing it to midyear 2019).2 And while the MCCA has about 70 departments that report data, not every department reports every year, and those departments that do report do not always report a full 12 months of data. All told, fifty-four departments provided complete mid-year and year-end data every year from 2019 to 2024. The table below provides the aggregate midyear and yearend homicide totals for those departments.
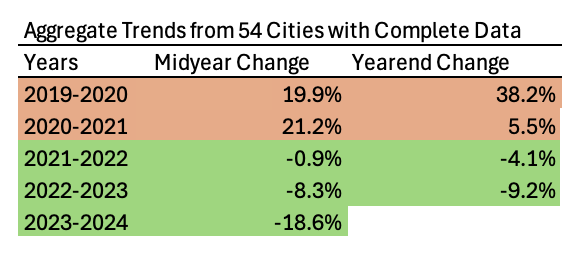
Three points to note here:
- For the four years with both midyear and yearend data, the trends are the same at yearend as at midyear.
- It’s true that the magnitudes differ, although inconsistently (yearend is worse than midyear for 2019-2020, but better for 2020-2021). These differences likely reflect the timing of the Covid spike and the onset of its decline. The spike started in the second quarter of 2020, and the decline likely began in the second half of 2021. In other words, the inconsistencies do not appear to just be noise, but reflect identifiable national trends. That should shape how we think about what yearend 2023-2024 will look like.
- Importantly, building off that last point, in 2022-2023–a year with less identifiable inflection points–midyear and yearend trends are really close. My sense is that, at least so far, 2023-2024 “feels” like 2022-2023: a year with no clear shock, and thus a year with no reason as of yet to expect yearend to look radically different than midyear.
So that’s the first part: midyear MCCA data does a decent job predicting year-end MCCA data. The sample size here is only four years, which isn’t great, but still, it’s promising.
But can we extrapolate the results from a handful of departments to the US as a whole? At first blush, it’s not a crazy idea. Crime is really concentrated, so the departments in major cities handle a lot of the nation’s cases. It’s still not, however, the sort of point one can just assert. The next table thus compares yearend homicide trends in the MCCA to those from the FBI. Here, I am using even fewer cities than in the previous one, since only 43 departments provided complete data to the MCCA every year from 2014 to 2023.
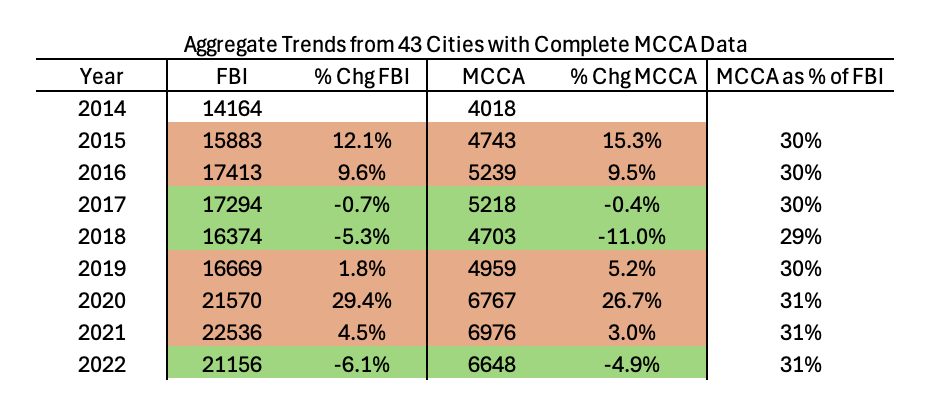
Remarkably, for every year the trend in the MCCA matches that in the national data. In some years, even the absolute values are close. The last column helps explain why. Despite looking here at only 43 departments–about 0.2% of the nation’s 18,000 departments–these departments consistently experience ~30% of the nation’s reported homicides. It’s not surprising they the drive the national results.
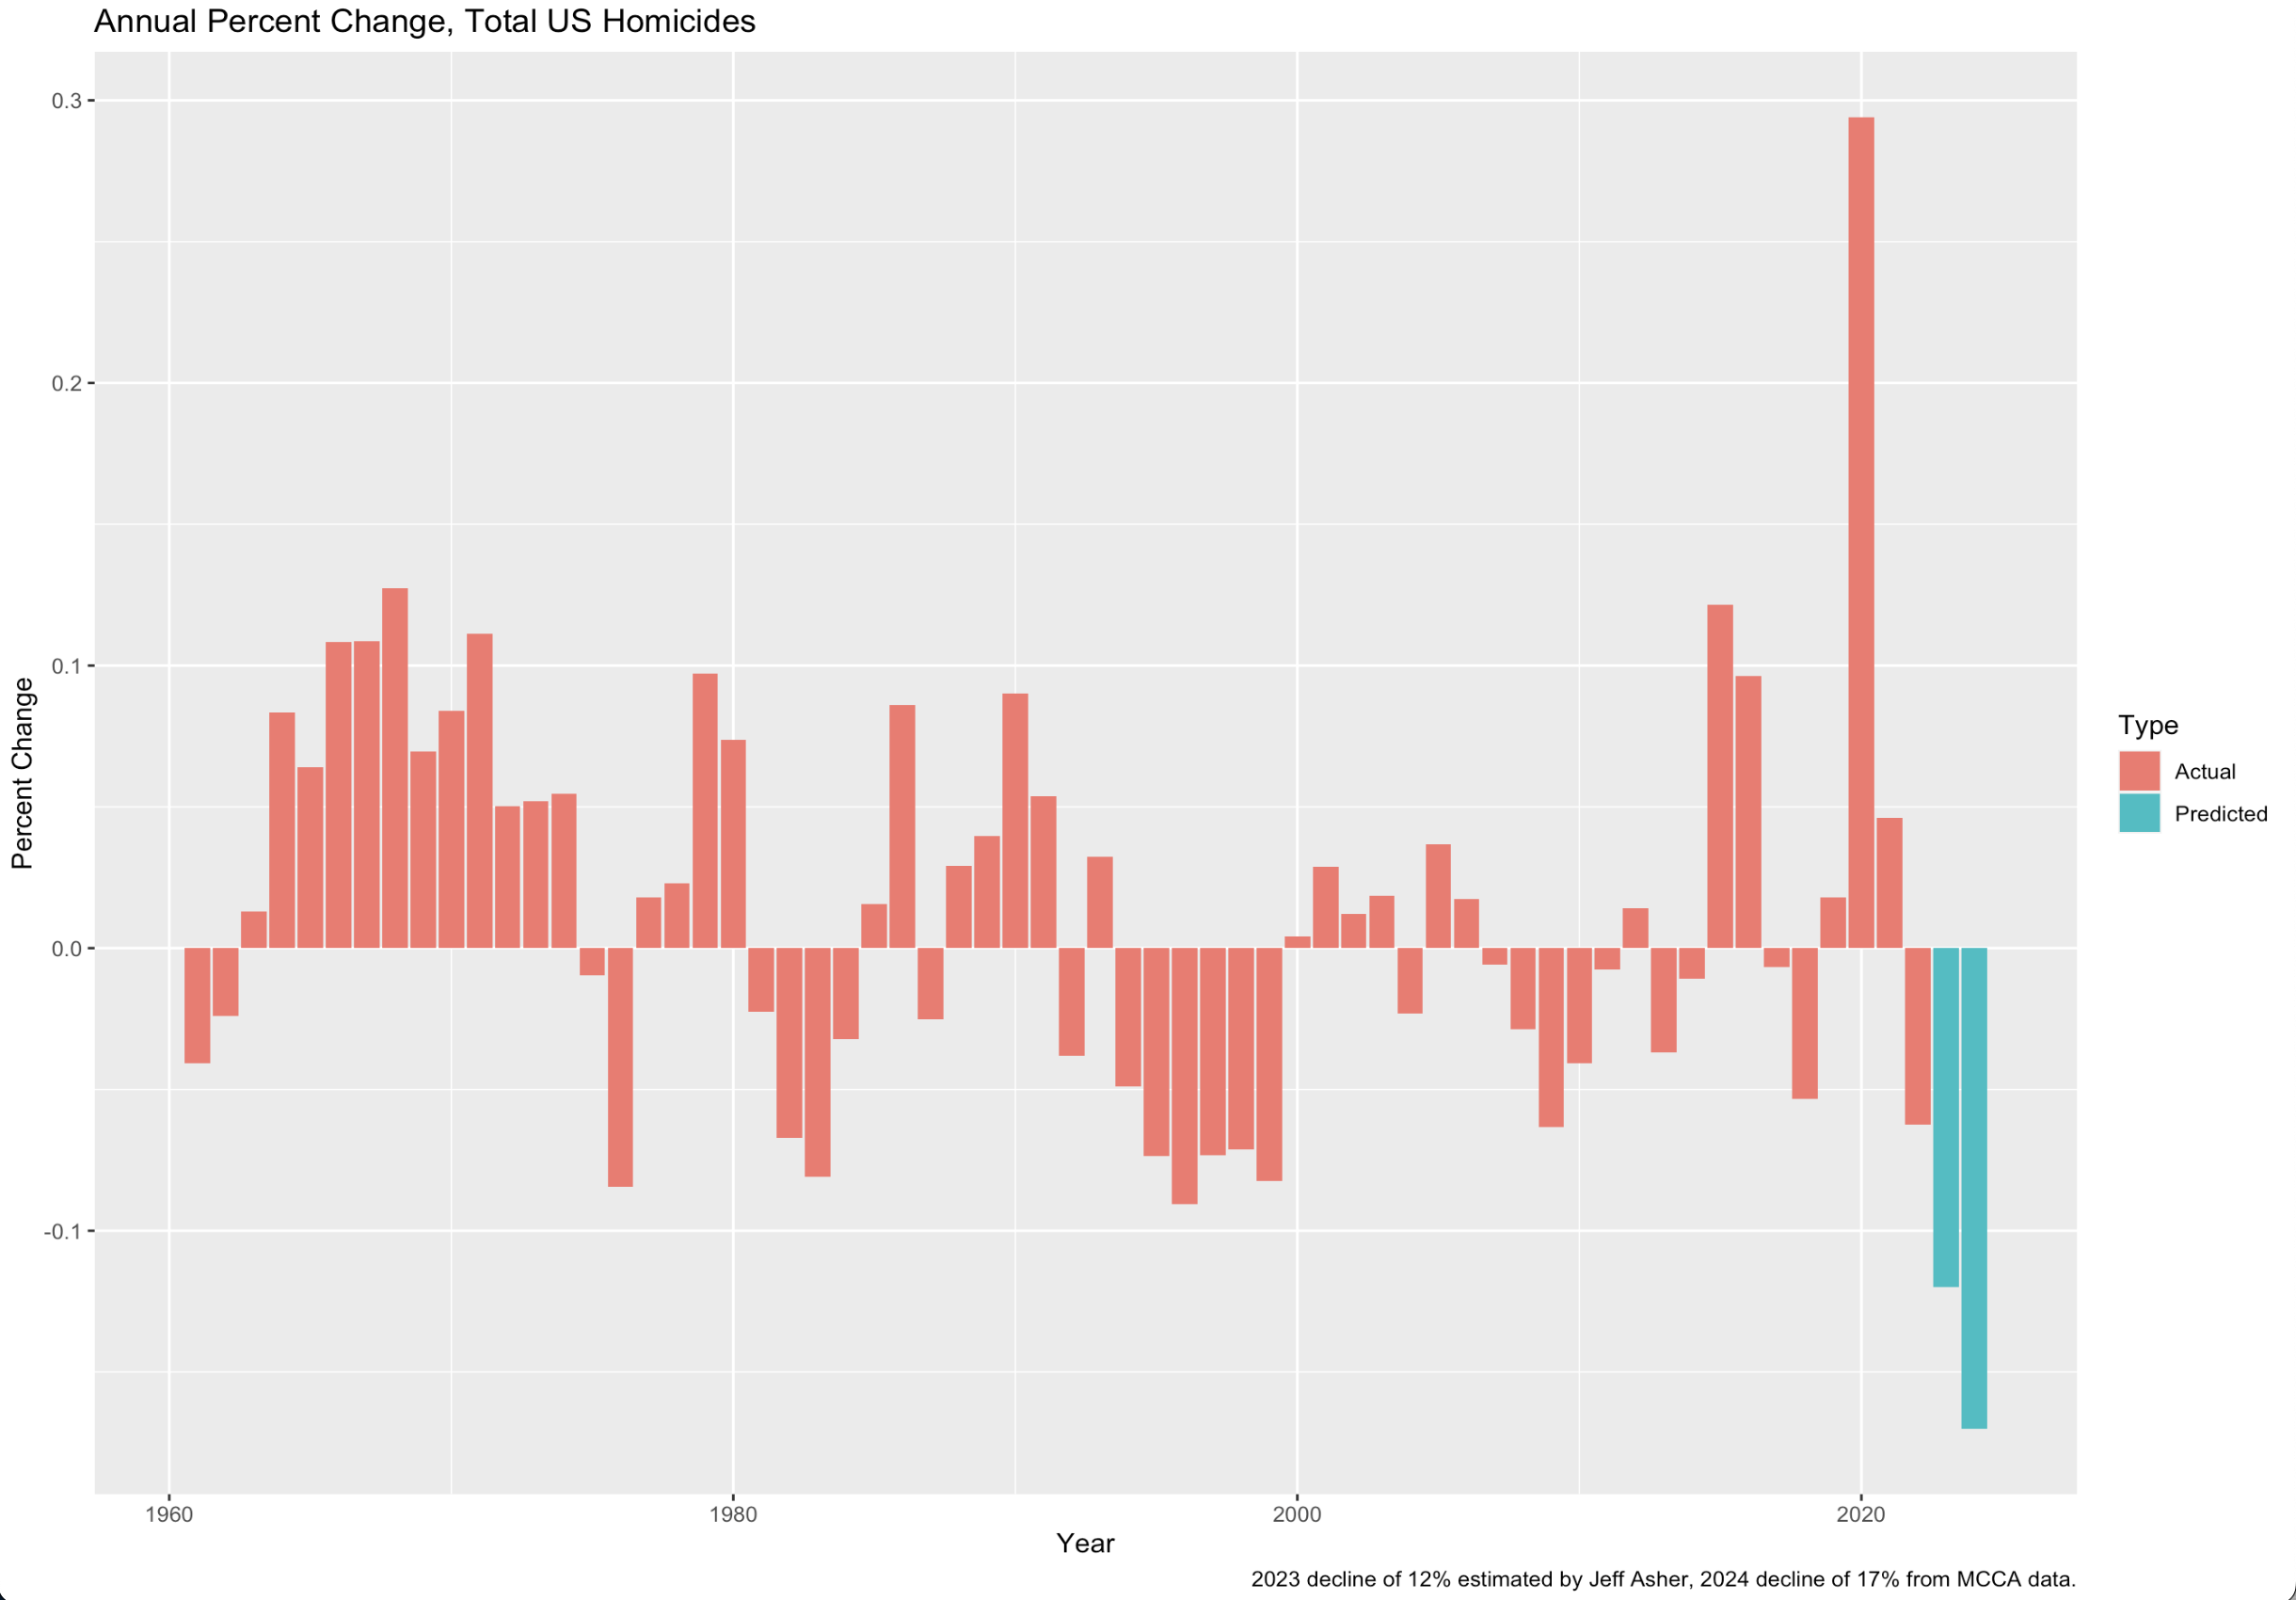
Taken together, these two tables tell a simple–honestly, to me, a surprisingly simple–story. MCCA midyear data predicts MCCA yearend data, and MCCA yearend data tracks national yearend data. All of which is to say, barring some sort of unexpected reversal in the latter half of the year, we are looking at historic declines in 2024. Just consider this graph of annual percent changes going back to 1960-61. No year comes close to what 2024 is on track to experience; even if the latter half of the year is so bad that the yearend decline is half the midyear, that would make 2024’s declines the second or third largest in recent history.
One Brief Limitation to Consider
Now, no analysis of criminal legal data is ever really complete without some sort of discussion about all the ways the data are messy and misleading and hard to use. Here, I want to just highlight one issue with the MCCA: its annual numbers jump from year to year, at least for some (always changing set of) cities.
To facilitate comparisons, the MCCA releases data in sets of two: the 2024 Midyear data reports midyear counts from 2024 and 2023; the 2021 Yearend data has yearend data from 2021 and 2020; and so on. In theory, the 2019 yearend data provided in the 2020 Yearend Report should be the same as the 2019 yearend data given in the 2019 Yearend Report. This is … not always the case.
In the aggregate, as the next two tables show, the effects are not that large, and they would be able to change only results that were on a knife’s edge.3
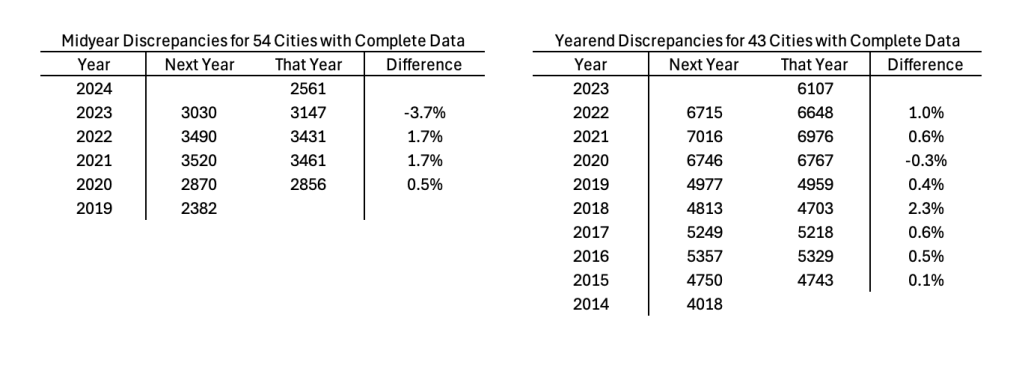
But the relatively minor aggregate discrepancies can mask some significant city-specific discrepancies. And it isn’t that specific cities are generally better or worse. The errors seem to be more randomly distributed. For example, in the midyear data, Philly’s numbers match perfectly, except for 2023’s: in the 2023 data, the PPD reports 211 homicides at midyear 2023, but in the 2024 data the midyear count for 2023 has fallen to 105. So is the decline to 61 in 2024 a 42% drop (from 105), or a 71% drop (from 211)?
In the midyear data, ~15% of all comparisons have an (absolute-value) gap of at least 10%, and ~7% have an (absolute-value) gap of at least 20%. Most observations thus seem reliable, but those looking at the MCCA to a more granular degree should double-check things first. In the yearend data, the numbers are more stable, with only ~5% showing discrepancies of at least 10%, and ~2% of at least 20%.
.
- Past performance is not a guarantee of future performance. Politicians should consult a criminologist before relying on the information here. Not FBI insured. ↩︎
- I’m guessing they started this response to demands for data in the early days of the Covid homicide spike. ↩︎
- The midyear data released in 2024 has data from 2024 and 2023. That means that data from 2023 appears in the 2024 report (as the past comparison year) and in the 2023 report (as the present, to-be-compared to year). So, for example, in the tables, for the line for Year = 2023 in the midyear comparison reports values for 2023’s midyear values as given in the 2024 report (the “next year” entry) and the 2023 report (the “that year” entry). ↩︎

No press release? How MAGA are the chiefs?
LikeLike
Pingback: The Democrats Have a Crime Problem. Blame the Media. | Billboard Lifestyle
Pingback: The Democrats Have a Crime Problem. Blame the Media. | Elle Fashion Magazine