I’m back to digging into what the National Corrections Reporting Program can tell us about prison trends over the 2000s and 2010s, and I’ll have a post up soon on some interesting results it gives about just how much of a “revolving door” our prisons are (it’s complicated!).
But first, I want to point out an important but deep-in-the-weeds issue with the NCRP. At a technical level, the audience here is the ten or twelve people (it feels like) who regularly use the NCRP. But there is a broader point here of more general interest: our crime and criminal legal system data are … a mess. And quite often, two datasets that should be measuring the exact same thing do not produce similar results. I’m not talking about a lack of precise overlaps. I mean they can differ as if they come from two separate universes.
At a technical level, that means empiricists need to be careful and constantly cross-validate things as best they can. At a more general audience level, it means … I’m not exactly sure, honestly. It definitely means people should be wary of claims made by people who just download some numbers and do some stuff with them, without necessarily really digging deep into the small print of the numbers they are using. Experts are experts for a reason, and a lot of their expertise isn’t technical skill but a fundamental understanding of what their numbers can–and cannot–say, and all the ways those numbers are an absolute mess too much of the time.
So here, what is the issue? The NCRP’s counts of why people are admitted to prison (new admission vs. some sort of violation return) are wildly different than those in the BJS’s other, far more widely used prison dataset, the National Prisoner Statistics (NPS). Some states are consistently good, but too many are consistently bad. Even worse, some states show wild divergences when it simply comes to “total admissions,” regardless of type of admission. And in neither case can we simply dismiss it as “different datasets using different metrics,” because the two sets track for some states, but not others.
Good times.
So here’s a simple look at things. For the states that provide consistent (“term-file”) data to the NCRP,1 here are graphs of the gaps between “percent of total admissions that are new admissions.” The red lines mark the +20%/-20% points. A value of, say, 5%, means that the percent-of-admits-that-are-new-admits in the NCRP are 5% higher than the same value in the NPS for that state in that year. Some states gaps of mostly zero: California, Colorado, New Jersey, New York by the end. But other states? Like Arizona, Tennessee, Washington? A lot more of a mess.
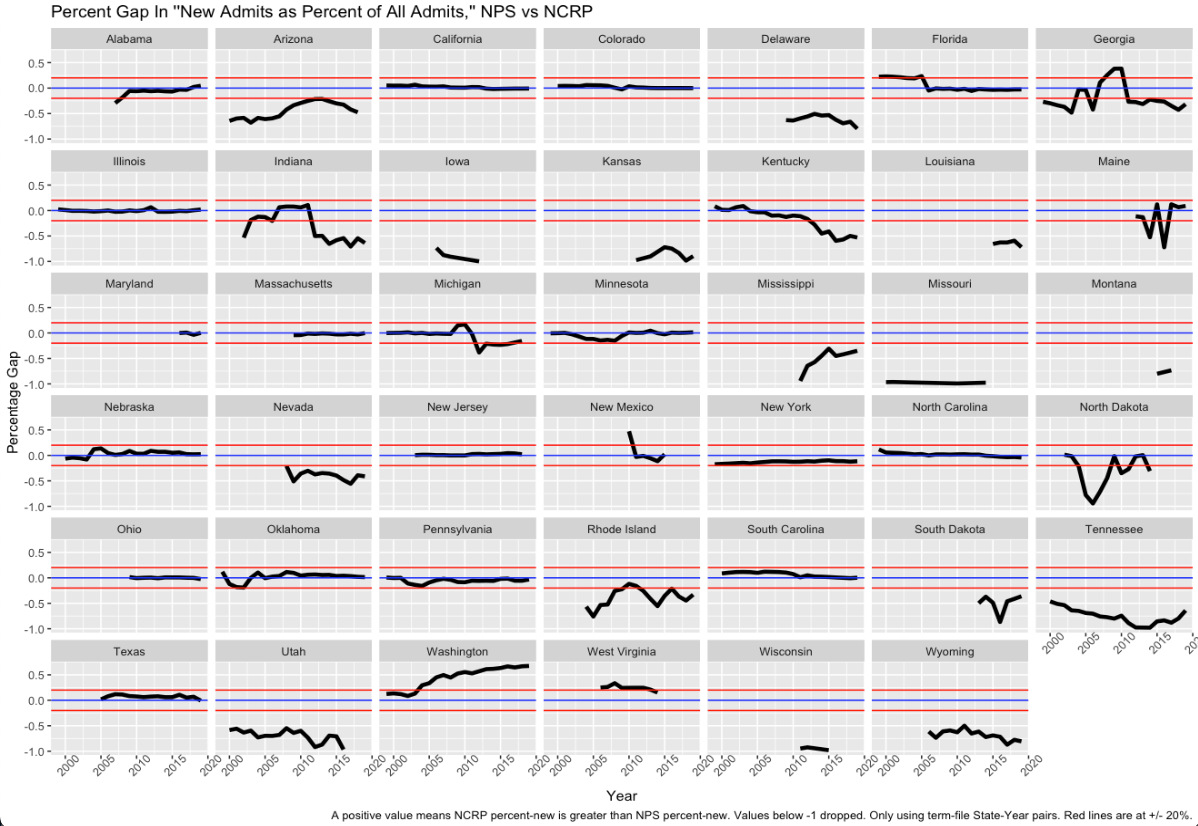
It’s not entirely clear why the “not so good” states are not so good. It is interesting to note that the errors tend to be that the NCRP is reporting fewer new admits as a percent of all than the NPS (the black line is in the negative); I have no idea why that would be, but it’s a pattern worth noting. But it’s not universal: Kentucky goes from too high to too low, and Washington goes way too high.
This, of course, means that we need to be cautious using either dataset when trying to get a handle on new admits vs. violation admits, which is a big issue when thinking about punishment, recidivism, supervision policies, and prison populations. And I think the caution runs in both directions: not knowing the source of the error, I can’t say which dataset is the more reliable one.
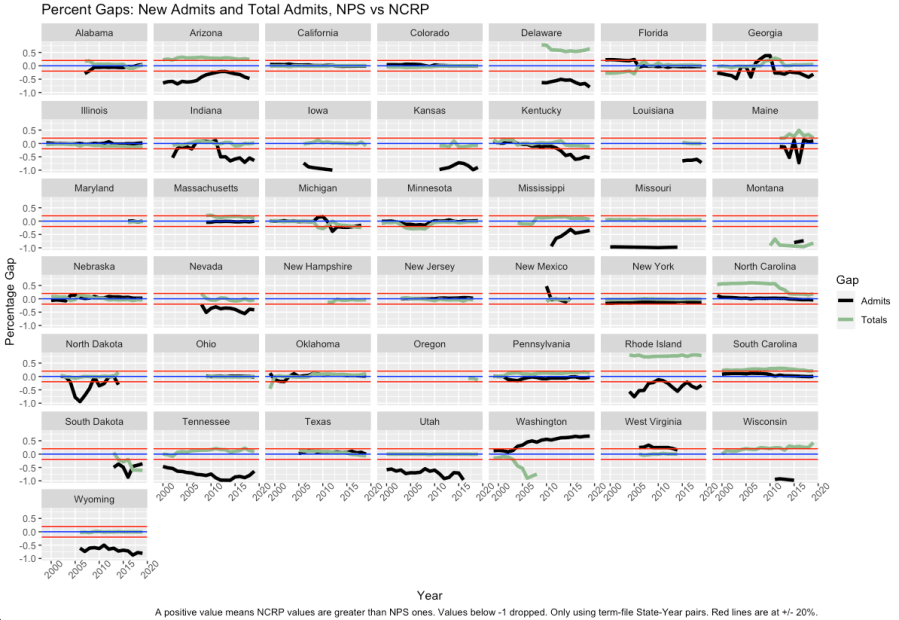
It’s also worth noting that sometimes the errors run deeper. The next graph combines two sources of error. The black line is the same as in the above graph: the percent difference between the NCRP and the NPS in the percent of admits that are new. The green line tracks the percent difference between the two for total admission, regardless of reason.
In other words, the errors in the pervious graph (and the black line here) could reflect misclassification of people. But the green line reflects not counting (or overcounting) people altogether. This is a much bigger problem, and points to problems not just with classifying, but with counting (which should be much more resistance to errors).2 States do better here–there are more states that fall within my arbitrarily-chosen +/- 20% error lines. But there are still some states that fail to see agreement for this far-more-simple comparison.

What makes this admissions divergence all the wilder is that one thing that makes the “term states” term states is that their year-end prison count tracks the NPS count closely. I’ve checked them all, and for all the years that states provide term data, the number of people still in prison in any state at the end of a given December in the NCRP is roughly the same as that in the NPS. Even when the admissions numbers are flailing around.
I don’t have any answers or explanations at this point. I’m not sure anyone does. A few years back, I asked some of the people at Abt, the contractor that the BJS uses to maintain the NCRP, if I could trust the “type of admissions” classifications in the NCRP for term file states to track those in the NPS, and they said they didn’t know and I’d need to check that myself. So I don’t think this is a well-known issue with the NCRP, and I wanted to flag it for those who use it.
The good news is that a lot of the large-pop states, whose policies have the biggest impact overall on national trends, have data that line up well (not that understanding smaller states or more-rural areas is not important). So there are parts of the NCRP that we can still use with a fair amount of triangulation-lines-up confidence. But even within the term file not all states are the same.
.
- Usually I try to explain all these terms for those who may not be familiar with the data, but I figure anyone still reading at this point actually uses the NCRP. But just in case people are still curious, the NCRP has “better” data, called “term” data, that is clean enough that the BJS can link observations across years (this admission in 2009 is the same guy admitted in 2002 and released in 2004). The less good, “widow and orphan” data, can’t link across years. We can see a guy admitted in 2002, a guy released in 2004, and another admitted in 2009, but we can’t link them together (although we can see that the guy released in 2004 was admitted in 2002, but we don’t know which guy he is, and generally it’s impossible to suss him out via the covariates). ↩︎
- Note that an error in total counts does not have to lead to an error in classification, although those seem correlated. If a state omitted a large number of admits at random, the total count measures would differ, but the new-admits-as-share-of-all-admits would still be correct. That there appears to be a correlation to the errors suggests that whatever is happening is not entirely random. Which is worse. ↩︎
