Whenever people talk about why our incarceration rate is so high, a very common answers is that it is “our long prison sentences” (and, far too often, “our long sentences for drug crimes”). And it is true that our prison sentences, especially for violent crimes, have the ability to stretch out a lot longer than those in Europe, which in some places are capped at around 20 years, even for murder (sorta).1 But the overall impact of longer sentences on the US incarceration rate is likely overstated, in fact likely significantly overstated.
Over a decade ago, I attempted to use an older, more unwieldy version of the NCRP to estimate the relative importance of changes in admissions vs. changes in time served to the growth of mass incarceration,2 and found that admissions were substantially more important. That paper was able to look at the 1990s into the early 2000s, albeit messily. Here, I have much cleaner data to use, but I’m confined to the 2000s–a useful era, and essential for understanding our present, but somewhat limited for explaining how we got to here.3
The following figure tells a pretty clear story. It plots the percent of those admitted in 2000 who were still in prison one, two, three, … etc., years after admission, broken out by broad type of conviction offense (violent, property, drugs, or public order/other), for states with reliable data from 2010 to 2020.4 Two features stand out. The first is that for all four types of offenses, at least half of all people admitted are released within three years (the 50%-still in line is the black horizontal line, the three-years-or-less-in-prison line is the black vertical line). In fact, for non-violent crimes, the median time to release is something on the order of one year, two years tops.

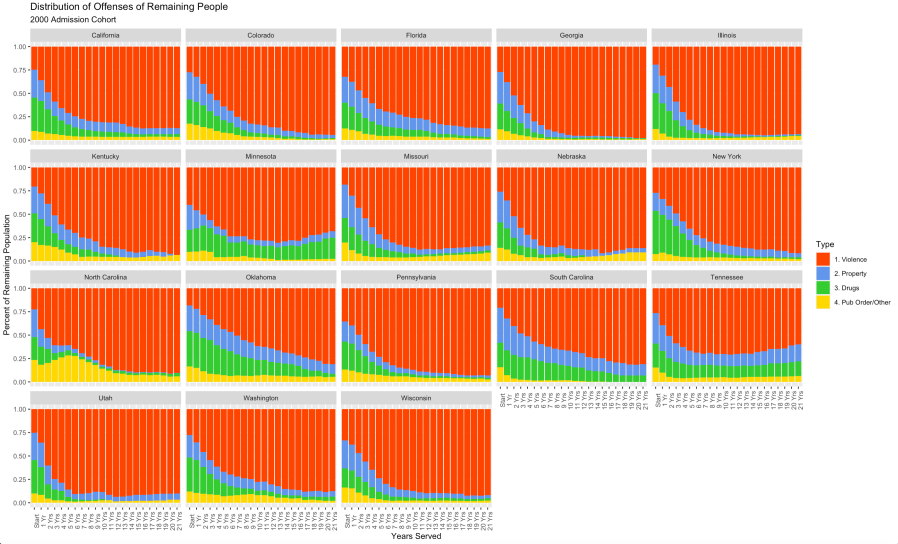
The second feature that should be fairly apparent here is that almost all the people serving long sentences are in for crimes of violence, contrary to the long-held (if slowly fading) conventional wisdom that mass incarceration is driven in no small part by people serving long sentences for drug offenses. To show this more clearly, the next graph plots the distribution of conviction crimes for those remaining in prison after one, two, three, … etc. years.
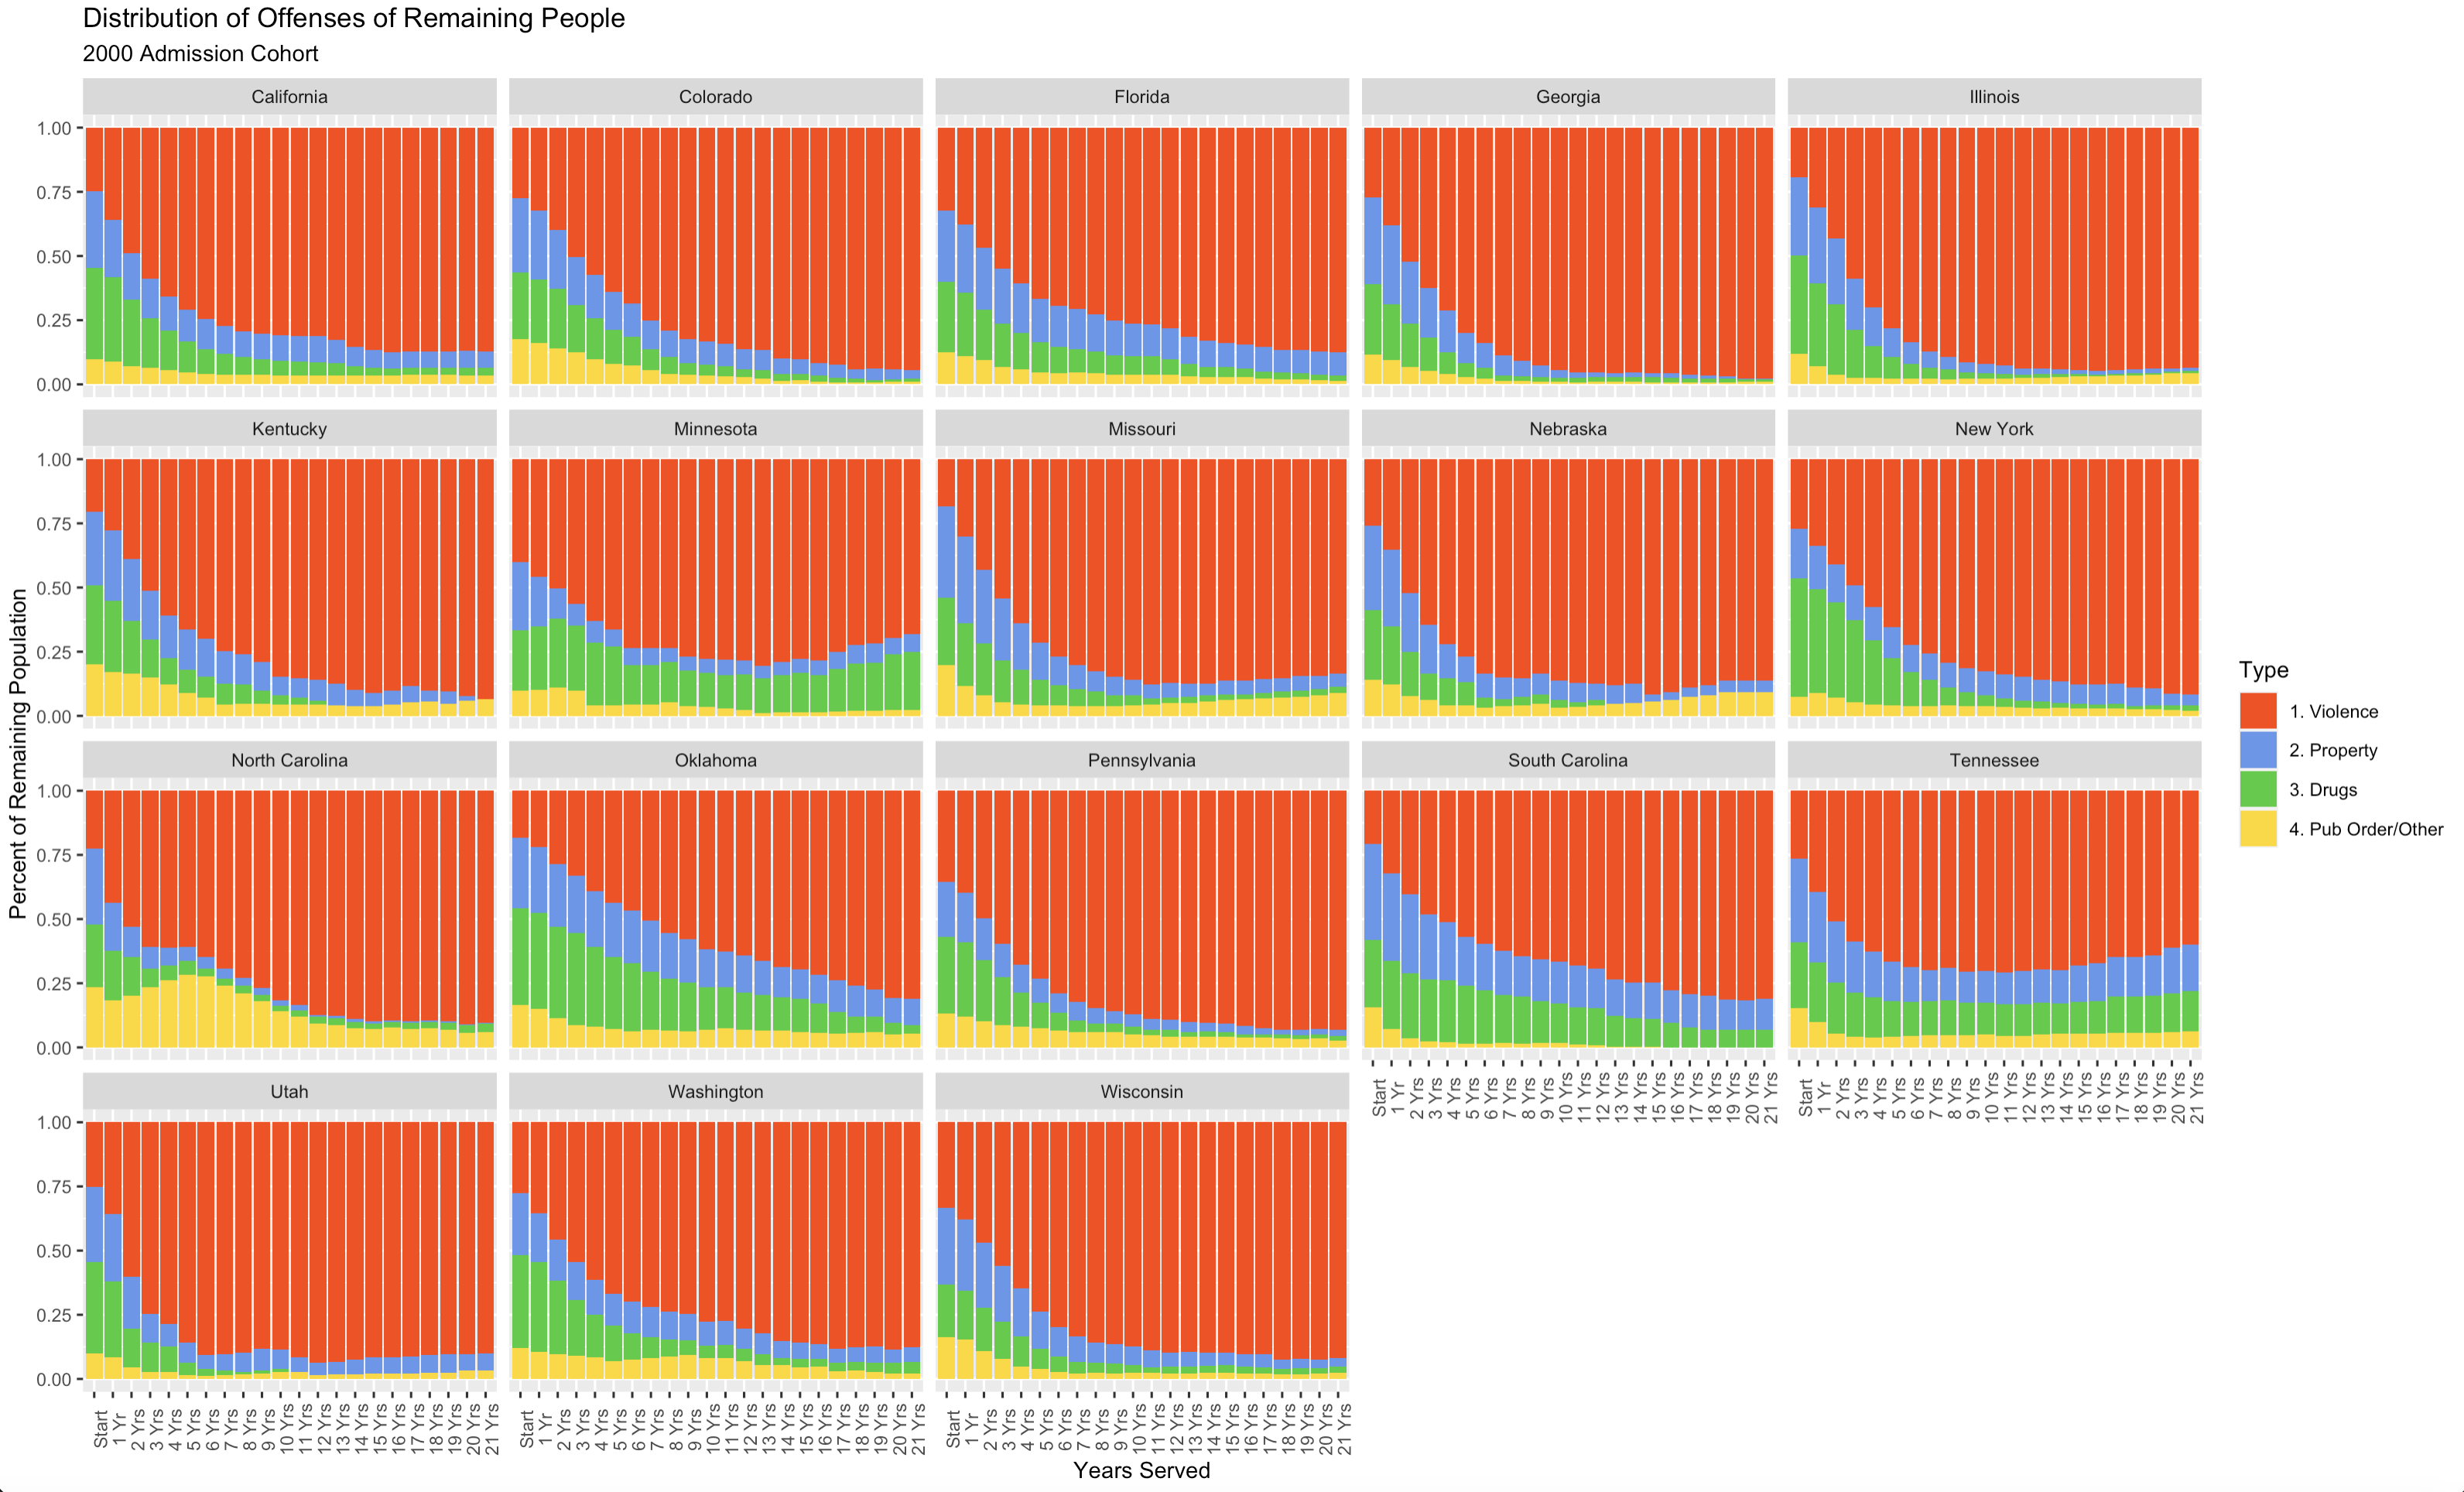
In nearly every state, those convicted of violence make up at least 75% of those serving long terms, often easily 90% or more. And for the states like Minnesota that have larger concentrations of those serving long terms for non-violent offenses, a critical caveat: the data here do not control for whether someone triggers a repeat-offender law.5 In other words, if someone who would’ve gotten 2 years on a drug offense gets 15 years solely because they get hit with a repeat offender enhancement, that “feels” more like a “repeat offender” sentence than a “drug” sentence, but that person would show up in the data as a “drug” case.
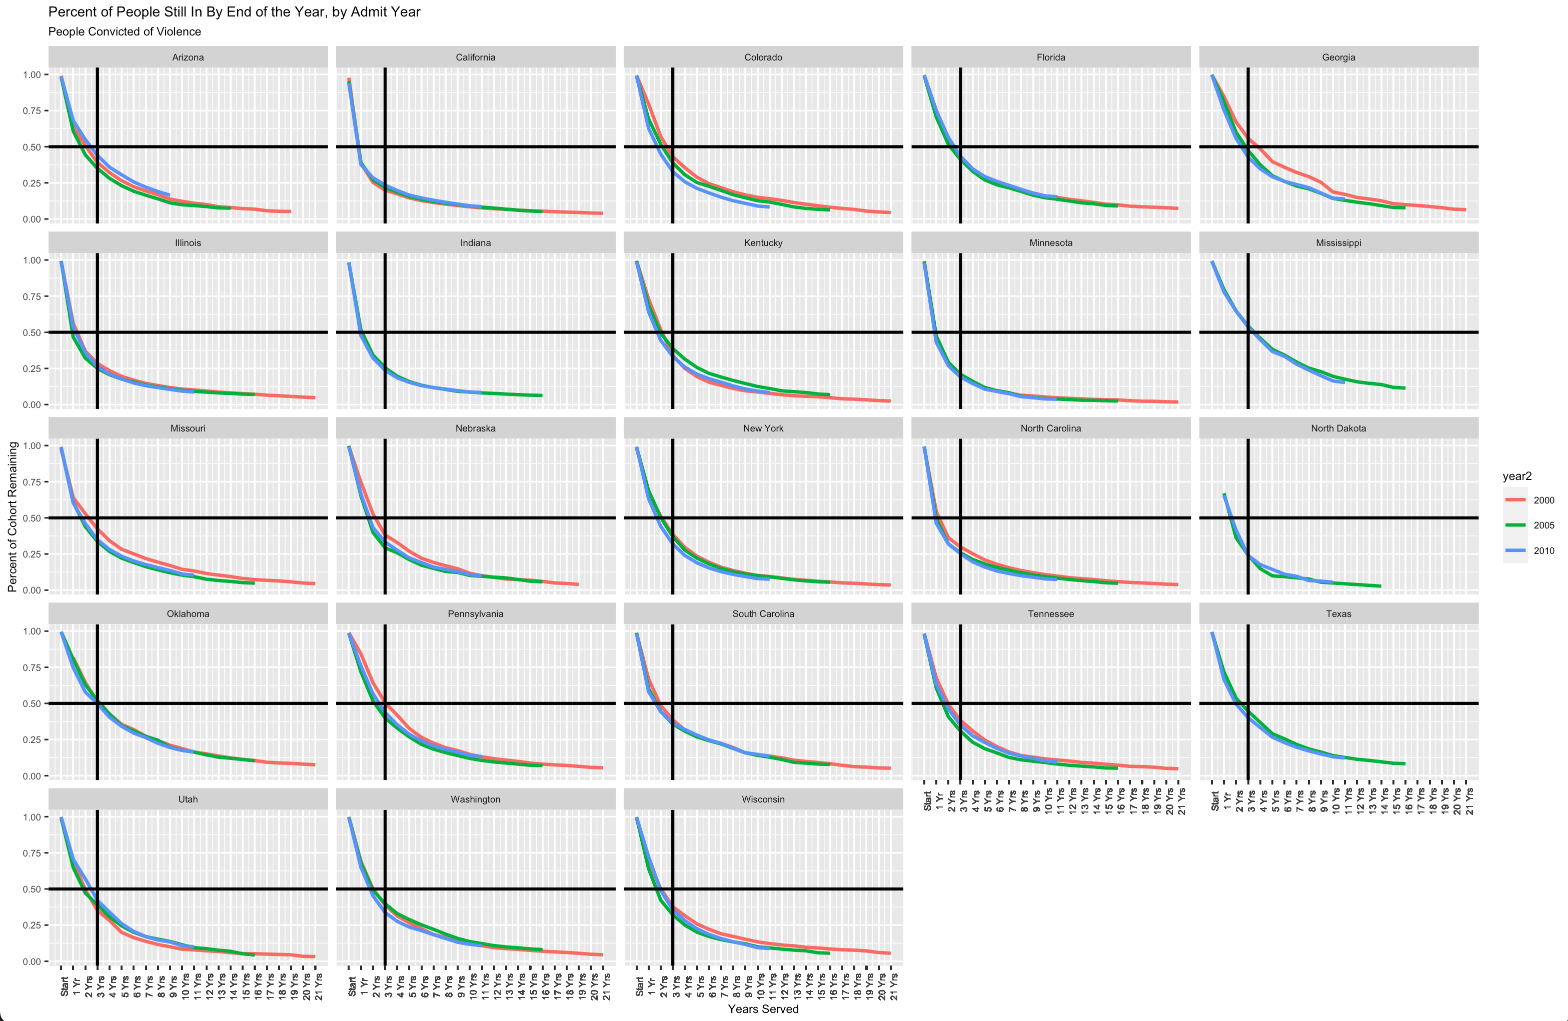
One other point I’d make here is that both the relatively-rapid release of those convicted of violence and the significant share of long sentences that are served by those convicted of violence appear to hold fairly constantly over the 2000s. This next graph is the percent of those admitted for violence left after each year (i.e. the same violence line as in the first graph), but overlaying the results from the 2000 admissions cohort with those from the 2005 and 2010 cohorts as well.6 What is clear is that little changes over these cohorts; if anything, the only trend we see (in places like Georgia) is that the rate of release for those convicted of violence accelerates over the 2000s.
Those who spend a lot of time in the empirical weeds here may notice that my results differ somewhat from a study Pew produced in 2012, showing that the average time to release for those convicted of non-violent crimes was ~2.2 years, and for those convicted of violence ~5 years. Pew is able to computer averages by looking at release cohorts, not admissions cohorts.7 So when they look at releases in 2009, they are looking at a release pattern produced by all the changing sentencing practices over the past several years to decades. It’s a useful way to look at things–in fact, my next post is going to dig a bit more into what looking at release cohorts say–but it can also be a trickier number to interpret.
These graphs illustrate the reservations I sometimes have with the focus on things like second-look acts. It’s not just that keep our focus on long sentences, while changing the decision whether to admit in the first place will be more consequential–a change that requires no legal reform, just the political reform of electing different prosecutors. It is also that far too often, these sorts of reforms explicitly exclude crimes of violence from their application, which means that they exclude right from the jump the vast majority of the cases that would otherwise qualify (although it is important to note that the National Association of Criminal Defense Lawyer’s model second look act intentionally avoids any such categorical ban).
.
- Sort of. These places also often have preventative detention, so the criminal sentence is capped at ~20 years, but the total amount of time confined might be much longer. Such is the case, for example, for Anders Breivik, the notorious Norwegian mass-murderer. But that civil confinement comes with regular parole hearings; the idea of life without parole is far more a distinctive American thing. ↩︎
- The older version only had separate admissions and release files, and combining them to generate estimates of time served was … tricky, given the rafts of errors and omissions in the data. A few years after I wrote the paper I was discussing it with some analysts from Abt Associates, who has the BJS contract to run and maintain the NCRP, and when I described how I cobbled the two datasets together, they gave me the sort of look I imagine people would have reserved for Dr. Victor Frankenstein had he described how he got the parts for his creation. ↩︎
- One of my next posts is going to look at release cohort data, which gives us some ability to peer into the past. ↩︎
- Some states have some missing years in the middle, some states don’t have data at the very end, others are messy in other ways. For those who know the NCRP, I limited myself here to states with term-file data for every year from 2000-2020. This gives me only 24 states, and while those include heavy hitters like California, Florida, and New York, it drops important states like Ohio and Texas. I’m generally wary of extrapolation here; it’s why I break out all the results by state and never give a single “United States” estimate of things. ↩︎
- There is one way to try to at least skim the surface of this issue, which I plan to do shortly. As I’ve noted before, the NCRP allows me to see if someone has been admitted more than once to a specific state. So it may be possible to look at what percent of people admitted for drug crimes in, say, 2010 and still in prison at the end of 2020 have a prior (observable) admissions vs. the same percent for those admitted for violent crimes. ↩︎
- The states differ here a bit because I added in a few states with 2005 and 2010 data but not 2000 data., and dropped a few that had some other limitations to them. ↩︎
- As a general matter, my approach here cannot calculate average times served, since as long as at least one person is still in prison for a given offense type, it’s impossible to know what the end point of time served is. But the median is trivial to compute with people still in prison. ↩︎

Pingback: A Second Look at Sentence Length: Looking at Release Cohorts – Prisons, Prosecutors, and the Politics of Punishment
Pingback: A Final (For Now) Look at Sentence Length: Those Still Serving – Prisons, Prosecutors, and the Politics of Punishment