Edit (Jan 17, 2024): Since posting this, I’ve realized that the Census data for expenditures that I rely on here does not take pension expenditures into account (see page 9 here). I’ve heard from at least one policy analyst that the ASGF numbers don’t seem to track the state’s own corrections budget numbers, and this strikes me as the most obvious explanation (though I’m still looking into this). But it is definitely a limitation in the ASGFs that merits consideration (here, and in all situations where it is used to look at employment-heavy government sectors). •
.
Many prison reformers, seeking to find allies among the more conservative, have often touted the alleged financial benefits of decarceration, claiming it would free up money that could be spent elsewhere. In fact, much of the (perhaps somewhat-overstated) bipartisan support for (limited) decarceration in the early 2010s came from an (unstable) alliance between liberal reformers and the budget-cutting wing of the GOP.1
I was always skeptical of this claim, for one simple reason. Approximately two-thirds or more of prison spending is wages, overtime, and benefits, and my sense is that the public sector unions who represent correctional officers are very good at protecting their jobs. I assumed that as prison populations fell, employment would not, and as long as employment held constant, so too would most of prison spending.
My assumptions were, to put it simply, incorrect.
The high-level takeaway is this. Between 2009 and 2019 (stopping before Covid mangles everything):
- State prison populations fell by ~10.8%.2
- State correctional employment fell by … ~9.8%.3
- Real state correctional spending fell by … ~9.8% as well.4
- And while nominal spending on corrections did rise, by ~7.3%, corrections’ share of state spending fell by ~23% (an absolute decline of ~0.6 percentage points, from 2.6% to 2.0%).
Now, of course, in a federal system like ours, national-level numbers can mask a lot of important inter-state variation. So this first figure compares state-level changes in prison populations to state-level changes in real (total) correctional spending. A few patterns stand out.
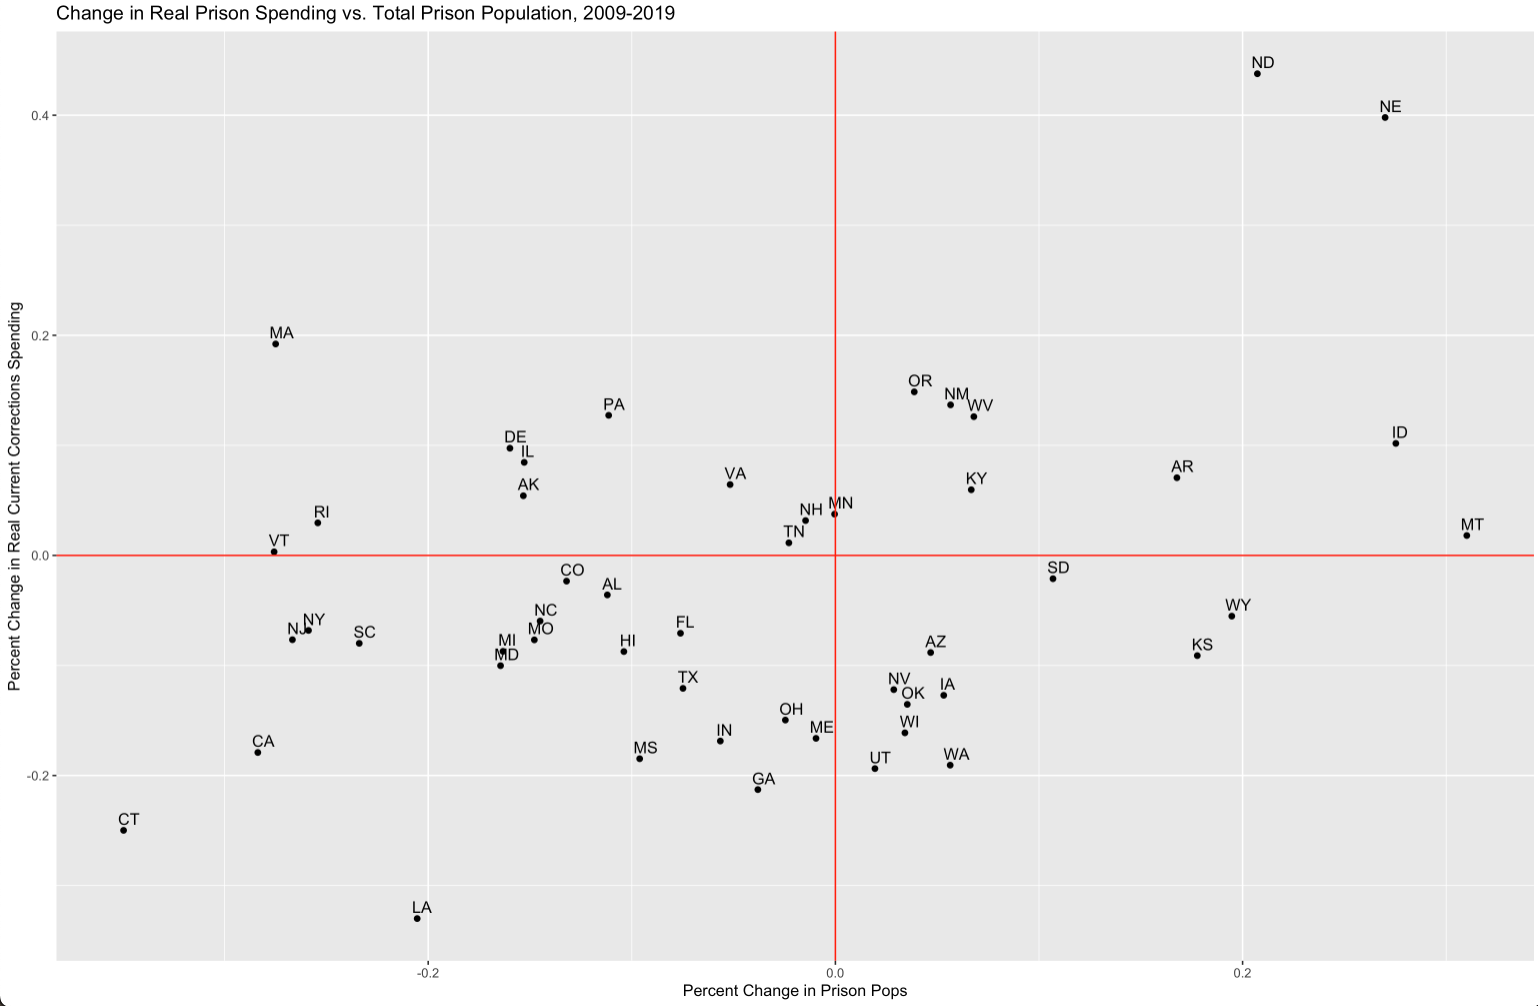
First, some states saw increases in spending with falling populations (the upper left), while others saw shrinking spending amidst rising populations (the lower right). The lower right is definitely the more concerning of these two quadrants, since these states run a real risk of seeing conditions worsen, which, in a lose-lose outcome, both traumatizes those in prison all the more and appears to lead to an increase in the risk of recidivism. The states in the upper right may be investing more in incarceration, but they may also just be working to improve prison conditions even as (because?) prison populations are falling.5
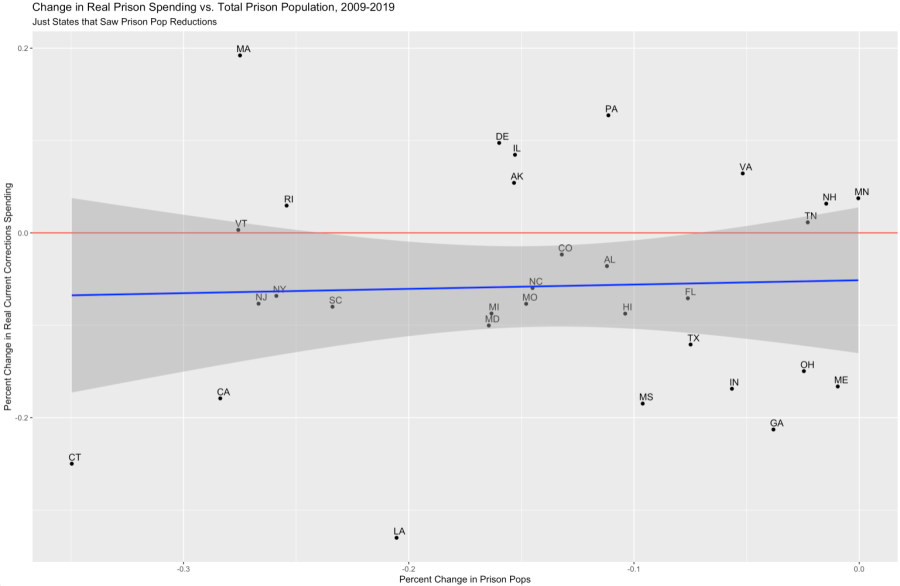
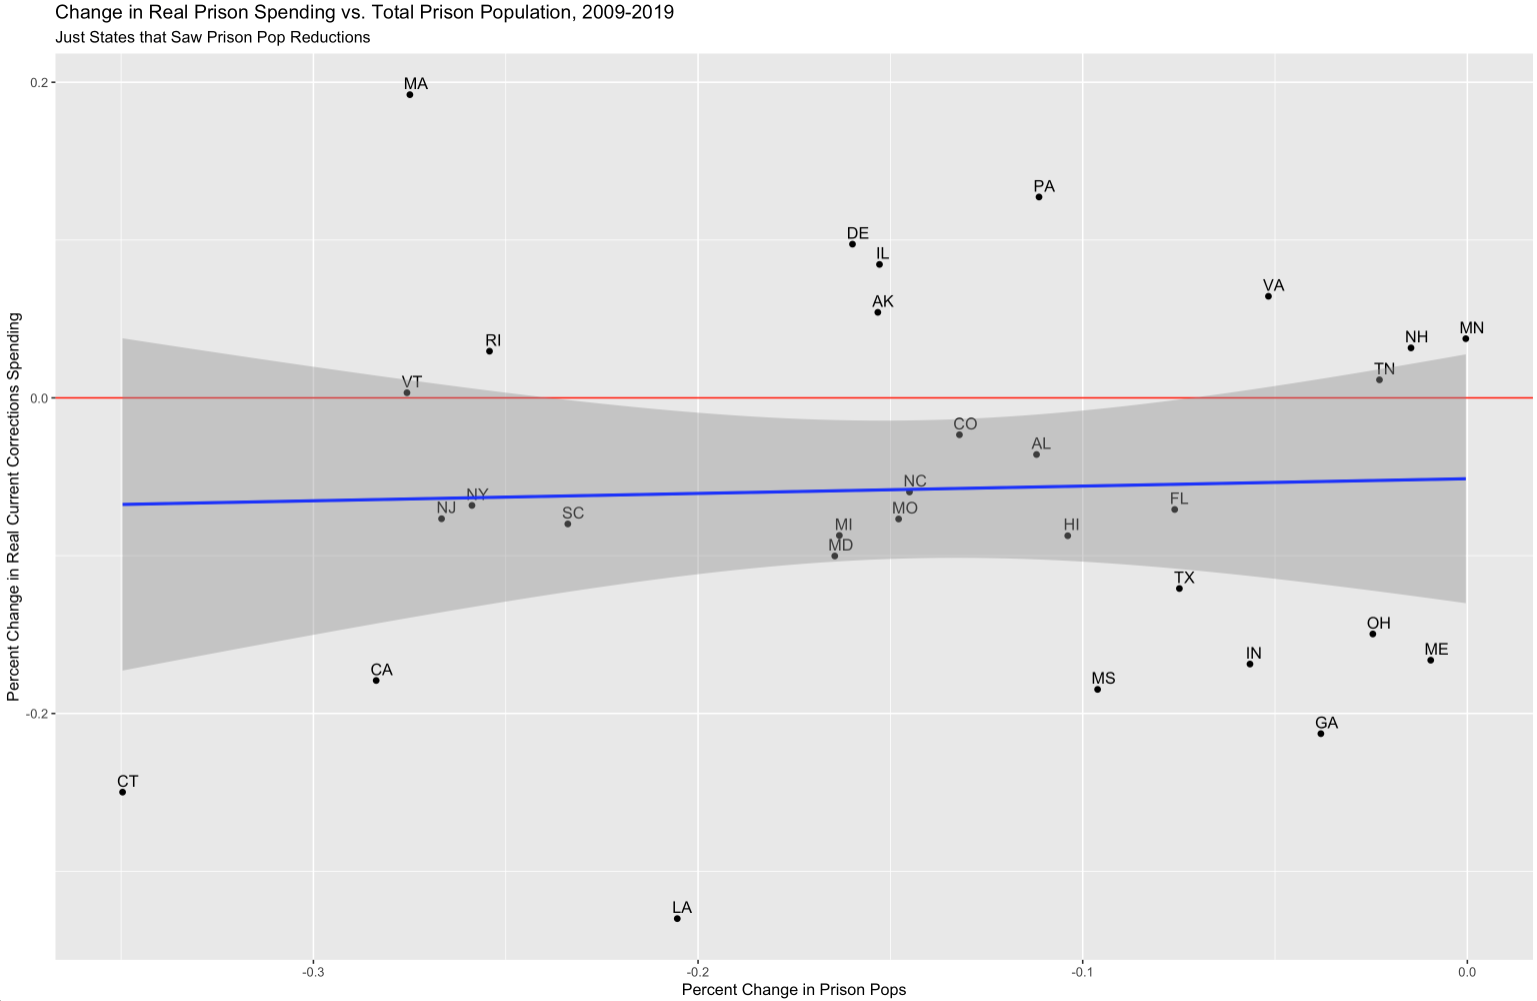
But second, there appears to be little immediate correlation between declines in prison populations and changes in spending, as the next graph shows. Obviously, a simple correlation line is not a causal claim, but it at least suggests that any sort of relationship is likely not too strong.6 In other words, the size of a state’s decarceration “dividend” does not appear to be all that closely linked to the size of its decarceration.
Looking at changes in total spending, however, may not really capture the “decarceration dividend.” After all, the real concern here is with correctional spending “crowding out” other spending. If total budgets rise faster than correctional spending, then even rising correctional budgets may reflect a decline in crowding out–and declines in total spending would likewise understate the decline in crowding out.7 And the data suggests that this sort of dividend has happened almost everywhere in the US, even in states that saw their prison populations rise over the 2010s. The next figure shows a pretty-much universal drop in corrections’ share of state budgets.
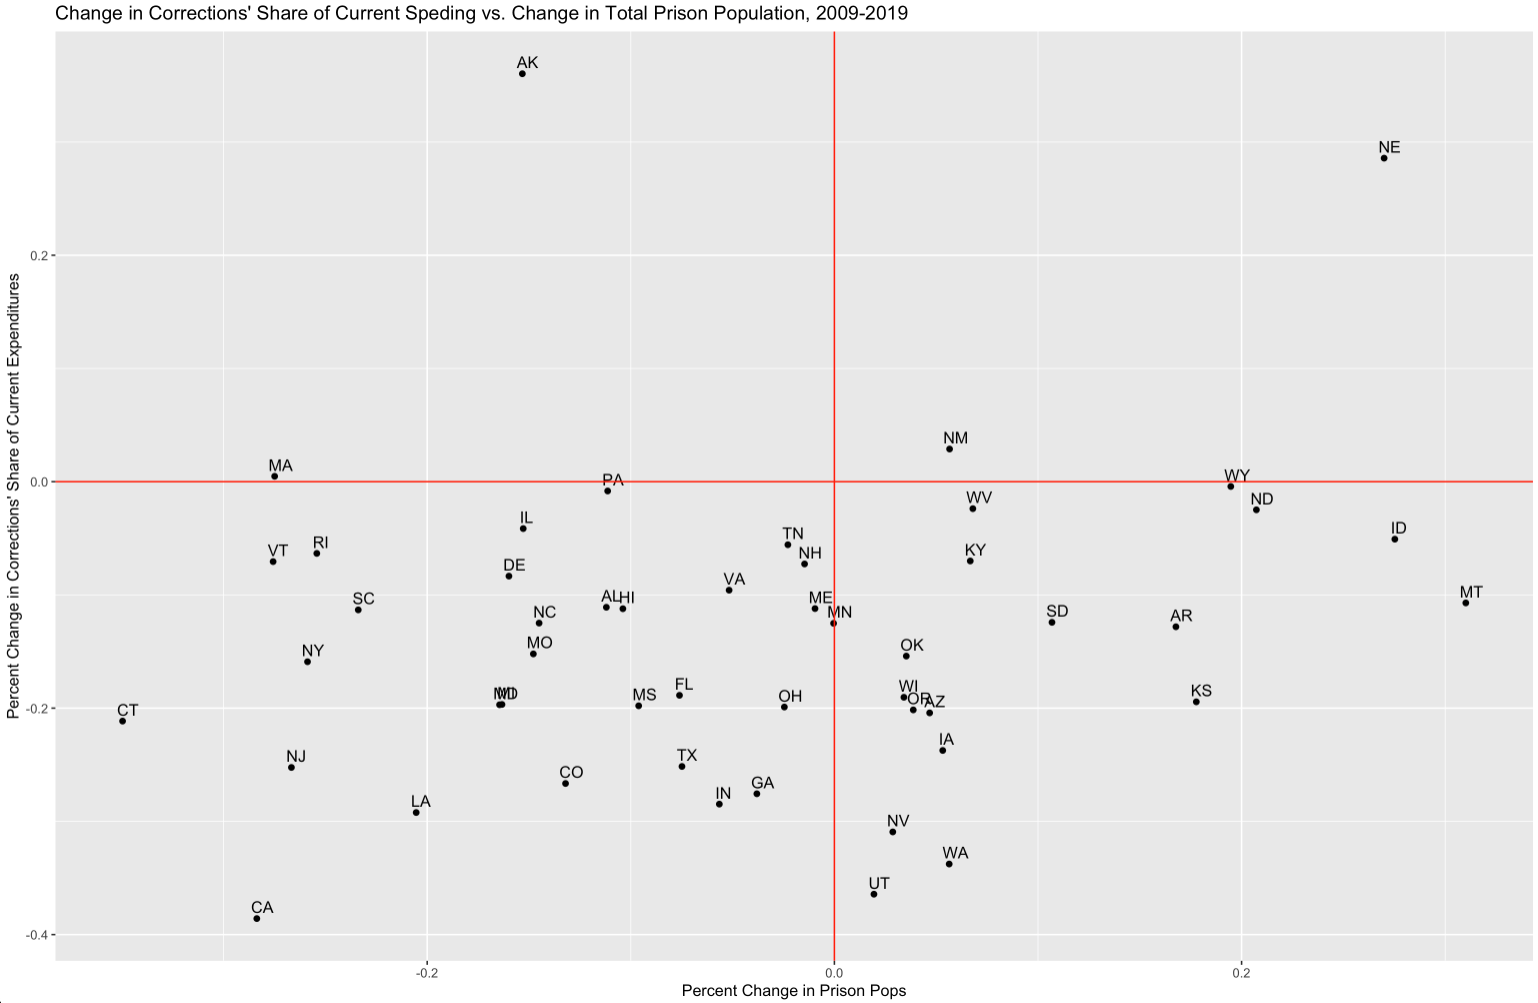
At first blush, it might be surprising that trends in correctional spendings’ budget share seems somewhat divorced from trends in actual prison populations. My guess is that this is a story in large part about employment.
The next graph plots changes in employment vs. changes in prison populations. The basic story is, except for Massachusetts way up there in the upper left, almost every state–regardless of trends in prison populations–has seen a fairly constant decline in correctional officer employment. In fact, for the states that have seen prison declines, there’s almost no correlation with declines in prison populations and declines in staffing (there’s a bit more of a positive one between prison pop growth and staffing growth for the states with growing prison populations).

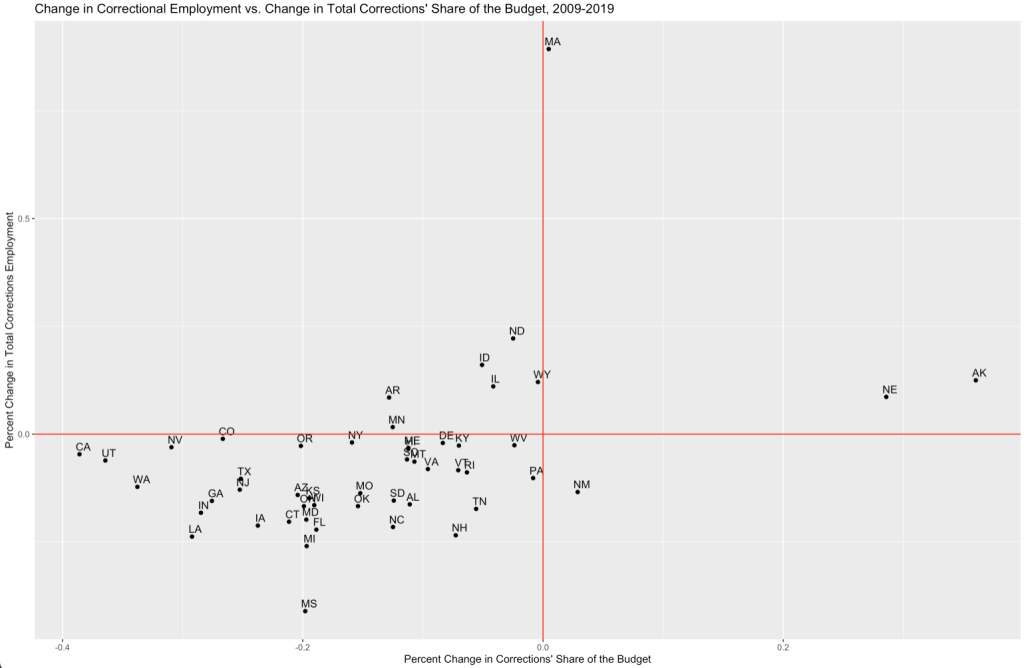
Now, to complete the simple overview here, if we compare changes in employment to changes in corrections’ share of the budget, they overlap pretty closely. They don’t fall along a 45-degree perfect-correlation line, but there are very few states that are in the upper-left or lower-right quadrants, where trends in employment and share move in opposite directions. Employment isn’t the only story, but it appears to be a big one–which is unsurprising, given it is a big share of correctional spending.
I want to conclude by just thinking a little bit about that seeming non-responsiveness of employment changes to population changes in the first employment graph (i.e., that declines in employment seemed to be fairly constant, regardless of the decline in prison populations). It could be that it reflects some sort of deeper political issue about unions or somesuch. But to some degree it also likely just reflects the (generic, theoretically non-political) relationship between staffing and prison population. Some jobs, especially the civil-side ones (like maintenance or accounting) are likely quite insensitive to CO staffing, much less prison population size. And even CO staffing surely doesn’t move 1-1 with prison population.
That’s not to say there’s nothing interesting to dig into here–there very well could be! In fact, that the national-level decline in employment did move almost 1-1 with prison populations really intriguing. But there’s also definitely some less-political, more-structural explanations at work here as well. Still
Finally, one really interesting open question to me here is the “how”? How did correctional staffing shrink? Was it due to cutting back the number of open positions as prison populations fell, or is it more a reflection that states are struggling to hire for open positions, and that in a time of falling prison populations they are less likely to take the sort of steps needed to bring in less-willing applicants?
The causal story of course matters. If the lines are still there but unfilled, it will be easier for states to eventually hire more people than if those lines had been intentionally cut back, which would in turn mean that an employment-driven dividend is less stable or durable than had those positions been cut. An important question for future work.
- It seems impossible to even think about it now, but there was a time when Cory Booker and Newt Gingrich shared a stage to talk about the need to reduce incarceration. I thought it was three life-times ago, but when I checked it was just 2015. ↩︎
- The data for prisons comes from the BJS prison-population tool. ↩︎
- Employment data comes from the Census Bureau’s slightly unwieldy ASPEP series. ↩︎
- Spending data comes from the Census Bureau’s ASGF series, but while the Census’s own website makes that data hard to use, the Urban Institute has created a fantastic site for downloading the data. ↩︎
- Of course, how that money is spent matters: money spent on programming may do more than money spent on correctional officer salaries. But better salaries–leading perhaps to better applicants, or perhaps retaining more-senior and thus more-experienced COs–may improve conditions as well. ↩︎
- If this is an area where endogeneity poses a real risk, I would want to be a bit more cautious with my causal guesswork. After all, it’s clear that the endogenous relationship between, say, policing or prison and crime can really mask a true causal connections. But that seems less likely here. For endogeneity to have some big masking effect here, we’d need one causal story to be “smaller prison populations lead to less spending,” which seems likely, and “less spending leads to more prison populations” which seems … less likely. It’s not impossible, but the most likely theory here–that it reflects something about the ideology of state governments (GOP states like larger prisons but don’t like to spend on them)–is complicated by the fact that the state government often has little control over the size of prison populations (which is driven more by Dem-leaning cities), and the primary control it does have (expanding capacity) works in expensive, non-continuous ways. ↩︎
- Now, to start, the idea that correctional spending meaningfully impedes states’ ability to fund things like education runs into the fact that only about 2% to 3% of state spending goes to corrections. It is simply not a major line item in state budgets.
County jails may tell a much different story. But even that would be a hard thing to interpret, because unlike states or cities, counties don’t … do much. Schools are local, highways are state, but I genuinely am not really sure how much counties do (even when I’ve lived in places like Buffalo or Chicago, with normal city-county arrangements). So jails could be a big percentage of county budgets less because they are crowding out other things, but more because there aren’t so many other things to crowd out in the first place. ↩︎
