
Perhaps the most high-profile reform prosecutorial administration was Chesa Boudin’s abbreviated term as the district attorney for San Francisco. After narrowly edging out incumbent Suzy Loftus 50.8% to 49.2% in November of 2019, Chesa Boudin failed to survive a recall campaign in 2022 by a vote of 55.0% to 45.0%. The recall campaign faced intense media scrutiny amidst aggressive campaigning, and national pundits such as Jonathan Chait were quick to argue that Boudin’s defeat–in liberal San Francisco of all places–“represent[ed] the long tail of a disastrously misconceived response by progressives to the problem of abusive and racist policing.”
Except the lesson from San Francisco is a lot more complicated than that.
I want to start, though, by looking at Boudin’s initial election, which was fairly normal. It’s the recall where the analysis gets confusing. Given all this, this post a bit longer than usual–so if you want to jump right to the recall discussion, you can click here.
The 2019 Election
An essential jumping off point is to note that, despite its liberal reputation, when it comes to criminal legal reform, San Francisco was never the most promising place for a reformer. The politics of the criminal legal system are inescapably bound up with race, and while San Francisco is a majority non-white city (under 40% of the population is non-Hispanic white), its largest non-white population is Asian, at ~37%. Its Hispanic population is ~15%, while its Black population is a hair under 6%, or less than half the national average. As some of my earlier work has suggested, this was not a favorable environment for a reform candidate. As a general matter, the communities that support reformers the most tend to be predominantly Black ones, with support declining in Hispanic and especially Asian communities.
And, perhaps unsurprisingly, Boudin’s election in 2019 was actually muchg narrower than its official narrow margin suggested. Officially, after the final round of SF’s ranked choice voting election, Boudin defeated Loftus 50.8% to 49.2%. But look at the bottom right corner of this image from the Boudin’s Ballotpedia page. Buried there, in the small print, is a cryptic reference to 22,612 “exhausted votes.”

Here’s the thing about ranked choice voting: it looks like it narrows the final round down to two candidates, but there are actually three. Even under RCV, “neither” is always an option, and that’s what these “exhausted” votes are–the people who did not rank either Boudin or Loftus, and thus could not be counted in the final Boudin-vs-Loftus round.
Now, if we ask how Boudin did among all votes cast, not all votes counted, he ends up at 44.9% of the votes. Loftus only got 43.4%, so Boudin still wins, but only with a plurality. Remember that number: 44.9%. Which basically rounds to 45%. We will see it again.
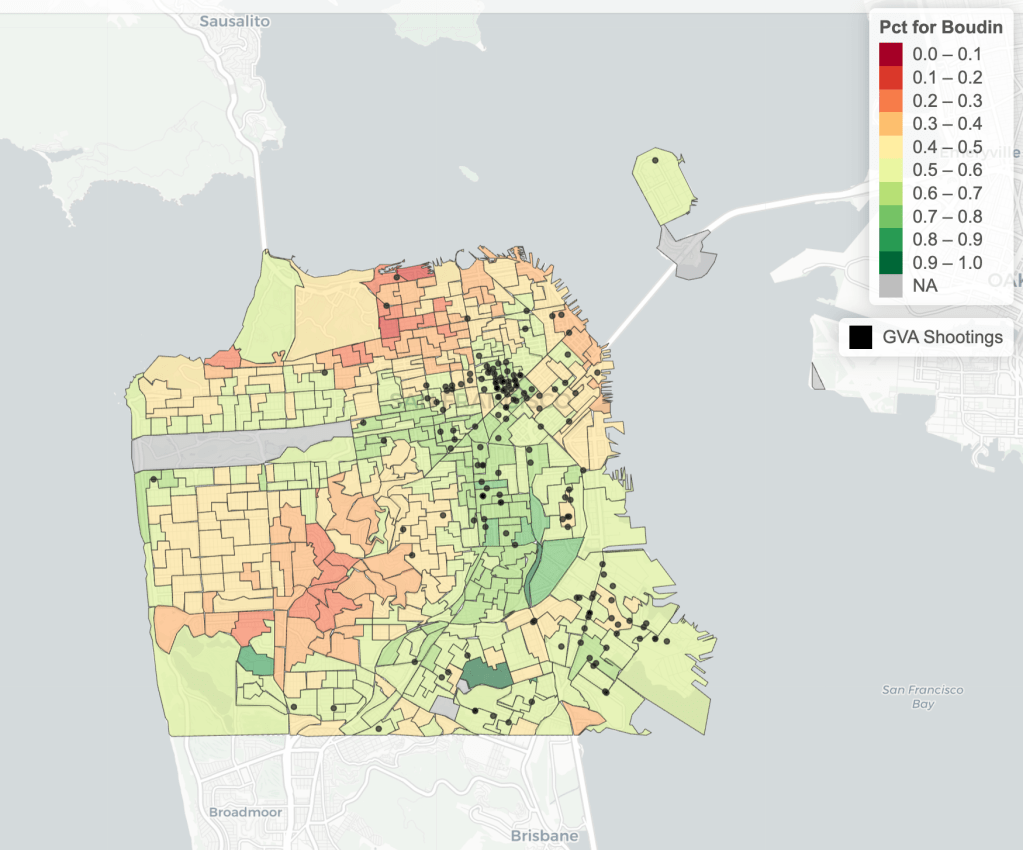
Putting aside Boudin’s pluralistic win for now, though, the precinct-win map (just for the final Boudin-vs-Loftus round) looks a lot like the other maps I’ve made for reform DAs, with Boudin performing well where shootings were most concentrated (with an important data note that I hope to fix shortly).1
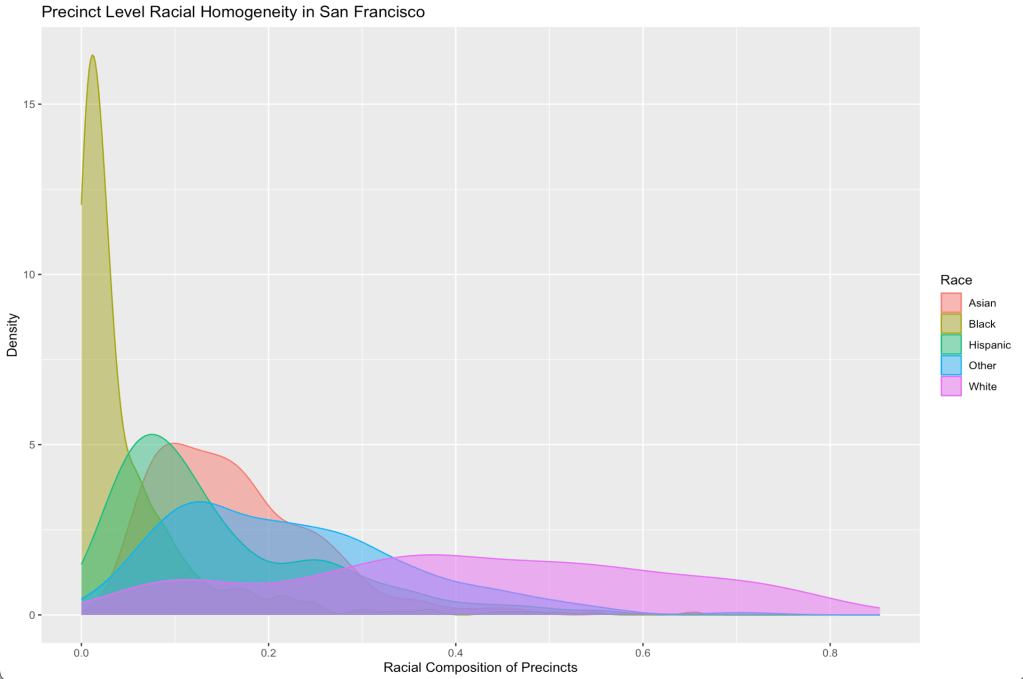
Assessing the role of race in this election (or the recall) is sort of tough for San Francisco, however, because a large number of its precincts lack any clear racial majority–and almost all that do are majority white, as the graph below make clear.2 Since voting is itself anonymous, and we don’t have much exit polling on prosecutor races–and exit polling itself is considered fairly unreliable anyway–I have generally used the racial composition of precincts as a proxy for the race of voters. Given how racially segregated our cities remain, it’s usually a decent-enough proxy, since there are usually a solid number of majority non-white precincts. But the lack such majorities in SF complicates that approach. It’s especially tricky given that many of the non-white groups likely view reform efforts differently, so racially heterogenous precincts are politically heterogenous here as well.
Interpreting the next graph is thus a bit tricky, but here’s the correlation between the share of a precinct that was non-Hispanic white and its vote share for Boudin. Two things stand out from this graph: Boudin’s support generally declined as the the precincts grew more white, but–perhaps a bit more surprisingly–Boudin’s strongest support came in the regions where whites were not a majority but came close (i.e., the middle), although that is also where he faced some of his toughest resistance.3

In fact, if I stop limiting myself to a linear regression and use something more unconstrained, it looks like support is fairly stable across the precincts until we get to the whitest ones, where support craters.4

The 2022 Recall
Having won a close race in 2019, Boudin assumed office in January of 2020, which was not the optimal time for a reformer to take over, especially one who won with so narrow a margin in the first place. Nor did it help that Boudin was the district attorney for San Francisco, a city with a large population of very wealthy and–at least when it comes to crime–fairly conservative tech-sector executives. Perhaps unsurprisingly, Boudin faced resistance fairly early on.
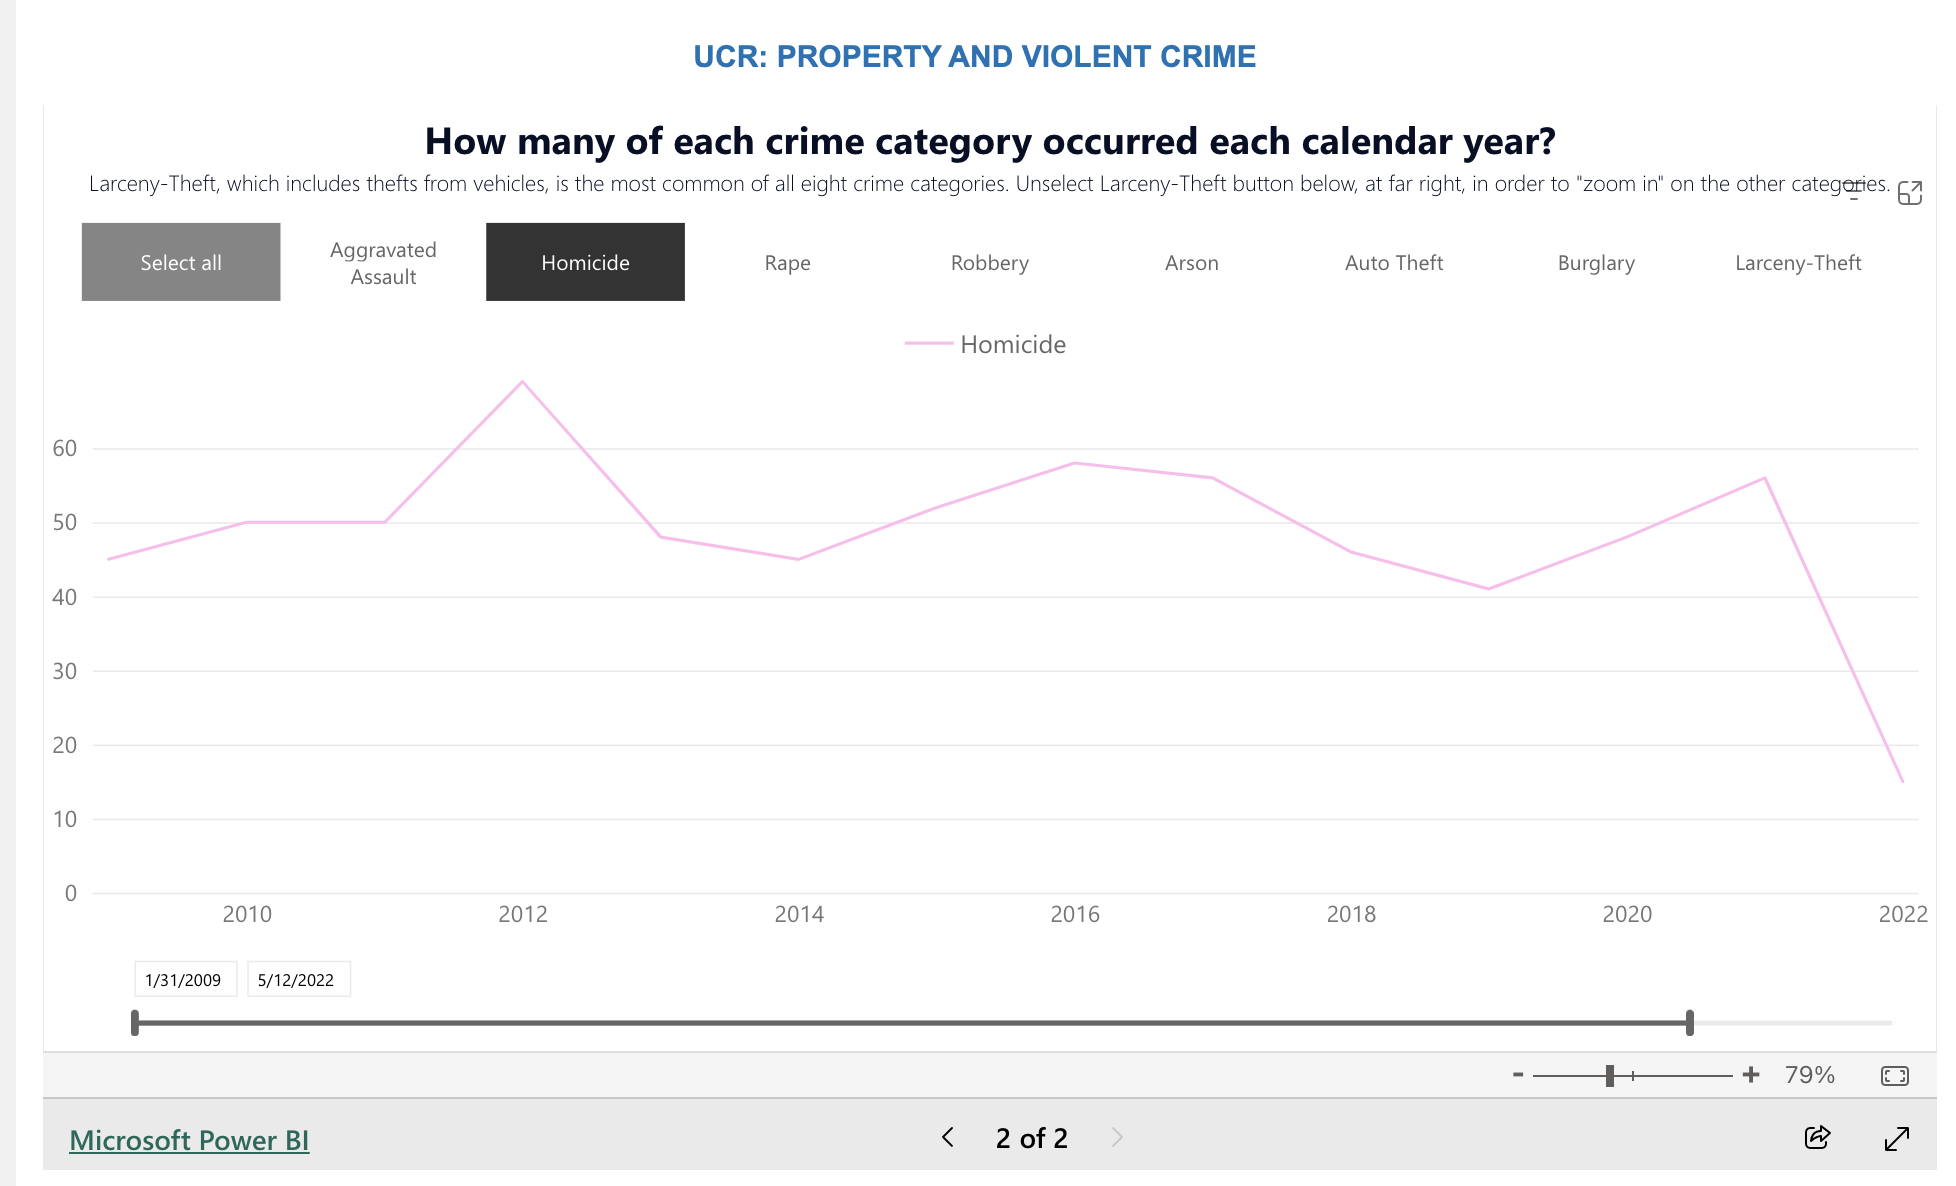
Now, overall, San Francisco weathered the 2020 spike in violence quite well.5 Amidst the homicide spike of 2020, San Francisco saw its total number of homicides rise by about four or five, from a recent-historic low in 2019 to something still close to near-historic lows, and most of its other crime rates were fairly stable as well (the data are all available here).
But that didn’t really matter. The conservative media nationwide and Boudin’s detractors at home portrayed San Francisco as a city falling apart and Boudin as the cause of that collapse. The rise in anti-Asian hate crimes during the pandemic also posed a distinct political challenge to Boudin, given the large Asian-American population in San Francisco (and some concerns about how he handled hate-crime cases against Asian-Americans).
The recall election took place on June 7, 2022, with the recall succeeding, 55% to 45%. Now, at first blush, this appears to suggest that despite little to no change in actual crime, a sustained media campaign arguing more or less the contrary had succeeded in pushing the vote five percentage points against Boudin, who had received ~50% of the vote in 2019.
It seemed like a classic example of the Willie Horton Effect: criminal policy driven not by a rational assessment of the data, but by emotionally gripping, but perhaps non-representative, anecdotes.
Except, that’s not quite the case. Recalls are strange elections. If nothing else, they don’t require you to choose between two (flawed) people. They just let you say “I don’t like this one, we can pick another one later.” Moreover, there’s another bigger, related, but less obvious, different. The 2022 recall only had two candidates (Yes or No), while the 2019 election’s final round had three (Boudin, Loftus, or the “exhausted” neither).
Remember that Boudin got only 45% of the three-way vote in 2019. Or, put differently, 55% of the voters chose Loftus or neither. Which is exactly the percent of voters in 2022 who chose to recall Boudin. The election outcomes were basically the same, once we take into account the “exhausted” votes.
In fact, if we look at the recall at the precinct level, there was almost no change in how the precincts voted, even though turnout was 15% higher for the recall. A precinct that voted against Boudin in 2019 and for the recall in 2022 with equal intensity would fall directly on the red, 45-degree line. Few precincts do exactly that, but the basic trend line across precincts (the blue line) tracks the red tightly.

In many ways, then, the recall was evidence of the Horton Effect failing, not succeeding, or at least succeeding much less than perhaps we would have thought. For all the negative campaigning, Boudin did … just as well in 2022 as he did in 2019.
Now, it’s not a purely simple story of “everything was the same.” For example, the racial politics do seem to move around a bit, with support moving away from the most-heavily non-white precincts.

Although, here again, if I free the regression line from its linear constraint, we again see a sharp drop in the whitest of precincts, but the relationship is less linear: there’s a decline in the least-white precincts, but an increase in support in the more racially-diverse ones in the middle.

In fact, when we dig into the racial story a bit more deeply, it gets a little more unclear. Below are four graphs that look at the correlation of the racial composition of a precinct with the absolute change in the share of the vote that went for Boudin between 2019 and 2022 (so a different y-axis than the previous graph, but one that sort of merges 2019 and 2022 voting into one number),6 limiting myself to precincts that were at least 25% of that racial or ethnic group. In other words, how do things look in precincts with sizable but perhaps non-majority numbers of that racial or ethnic group (given how few majority non-white precincts there are)?

What’s intriguing is that while precincts with sizable Asian and Hispanic populations saw declines in support for Boudin (while those with larger Black populations saw rises), the declines seem to fade as we move into the more homogenous precincts. Given some pre-recall polling data showing that Asians favored the recall the most,7 I expected to see the decline in support in the first graph grow more negative as the Asian share of the of district rose, not converge on zero.
In other words, it seems like Boudin’s support declined the most in the precincts that were the most racially heterogenous. Maybe it’s just something spurious, but it’s unexpected, and I don’t have a great sense of why this may be the case.
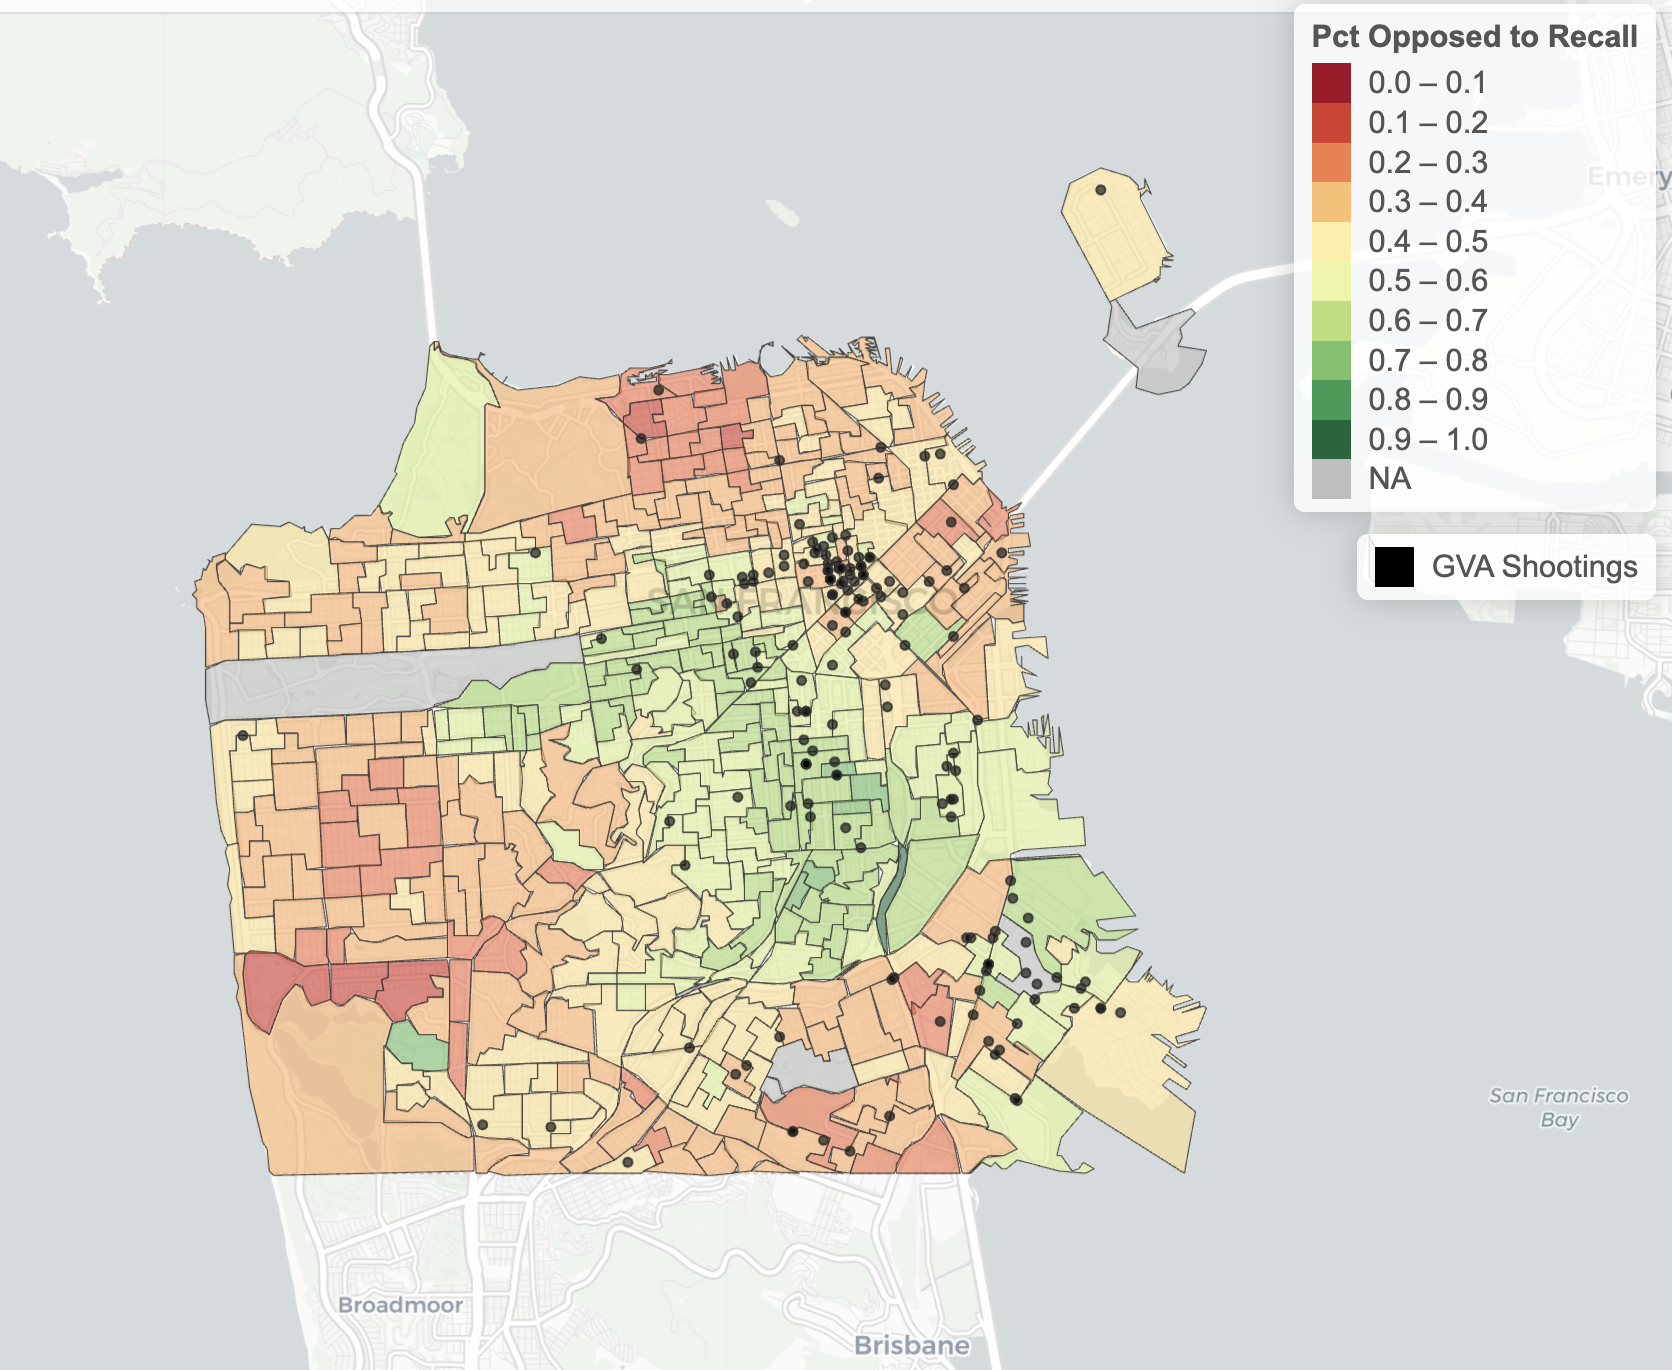
One other feature of the 2022 recall worth noting is that if we look at the election map for 2022, Boudin does suffer a noticeable drop in support in the area of the Tenderloin, which is around that cluster of shootings in the northeast. The common pattern that has been emerging in my work here is that the areas with the most violence tend to favor reformers. The recall map makes it clear that that is by no means any sort of iron rule.
To sum up, the recall is not a simple story of “those least impacted voted against Boudin in 2019 and 2022, and nothing really changed.” There were some shifts, and they merit some attention. But it is also the case that a lot did not change, and at a higher level is still does appear that much of the story of 2022 is just that recalls are different and Boudin never had a strong base of support from the start (of 2020). Pundits used San Francisco as some sort of national metaphor for “why reform DAs’ time is over,” when (1) that wasn’t the story for San Francisco, and (2) San Francisco is an idiosyncratic place to start with.
.
- The data note is that due to some sort of issue with the Gun Violence Archive that my RA is still dealing with, we don’t currently have the 2019 shooting data. So this is the 2022 data. The levels are likely not the same, but given the general geographic stability in crime, I imagine that the 2019 patterns will look roughly the same. ↩︎
- The graph plots the distribution of precincts by “percent who are x” for (non-Hispanic) white, Black, and Asian, and then Hispanic and “other” (mostly those who identify in the Census as more than one race or ethnicity). ↩︎
- You may wonder how Boudin won if the expected share of his vote is below 50% everywhere. That’s because this is his share of the total vote, of which he only won ~45%. ↩︎
- If you want to get into the deep, deep weeds here, the regression line in the first graph is linear, the second uses LOESS in R. I’m generally wary of lines that are more complicated than a simple straight regression line–there are real risks of spurious patterns seeming to emerge–but here it seems potentially useful. ↩︎
- I’m not necessarily giving Boudin any of the credit here–as a general matter, I don’t think prosecutors, tough or reform, have a major impact on crime rates (though they have some effect, to be sure). It’s policing that matters. But whatever my empirical perspective, the crime rate certainly matters politically to prosecutors, even if their ability to regulate it may be overstated. ↩︎
- In other words, a vote change value of -0.2 means that Boudin’s share in that precinct dropped by 0.2 points (from, like, 43.5 to 43.3). A value below zero does not mean that a precinct ever voted against Boudin (it could be a drop from 56.3 to 56.1), and a value above zero does not mean that the precinct ever voted for him (it could be a move from 34.6 to 34.8). But values above zero mean the precinct’s support for Boudin grew, and below zero that it declined. ↩︎
- The poll reported that Asian voters supported the recall at 67%, vs. 52% for Hispanics, 51% for whites, and 34% for Blacks. That Asian reluctance to embrace reformers likely extends beyond San Francisco and likely predates the pandemic and its associated anti-Asian rhetoric and violence. ↩︎

Pingback: Links 2/11/24 | Mike the Mad Biologist