Like seasonal allergies, claims about “defund the police” keep popping up with regular annoyance. Donald Trump just accused Democrats of trying to defund the police at an inappropriately-political police graduation ceremony on Long Island, and Hakeem Jeffries kept the trope alive by making sure to claim Democrats are opposed to defunding as well. And yes, it is true that some activists in 2020 pushed strong for abolition-level “defunding,” even making the op-ed page of the New York Times, and some local budgets did purport to cut police spending.
But budgets are tricky documents, and at times merely aspirational (like how the NYPD’s actual overtime costs are regularly far bigger than what is budgeted). So rather than look at rhetoric or aspirational budgets, to understand if defunding happened, it’s probably a good idea to just look at … what we spent.
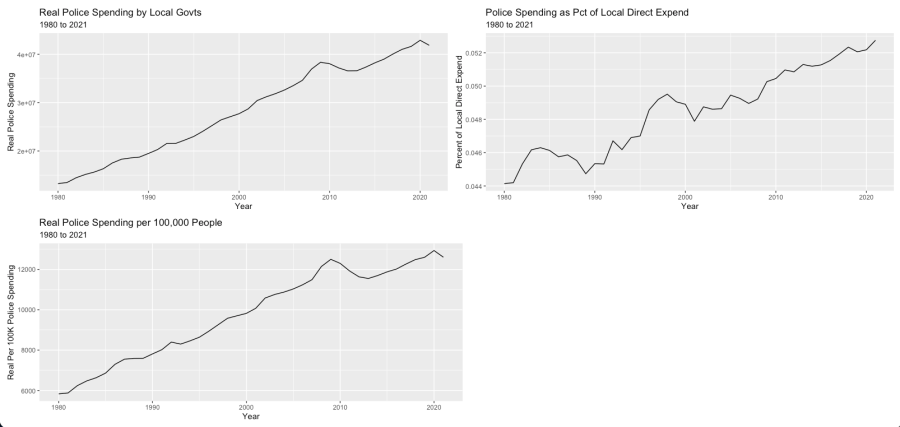
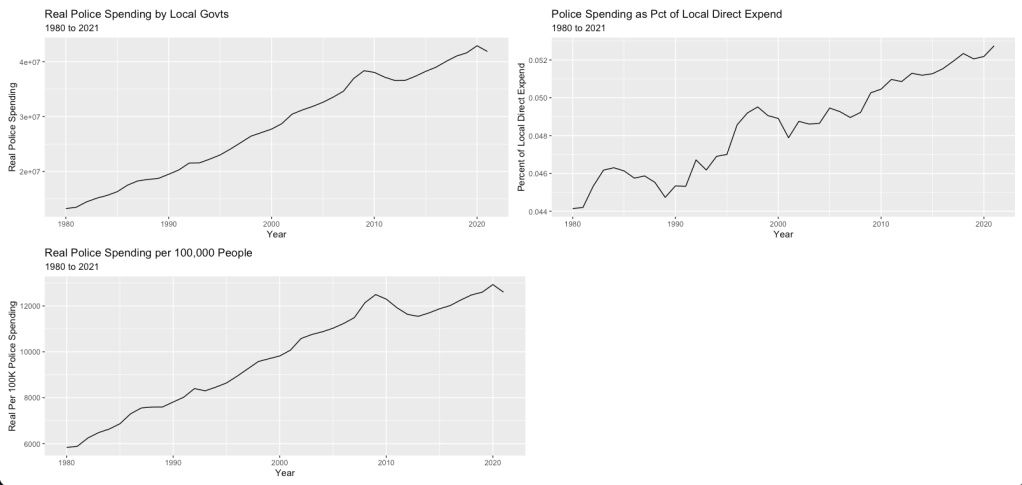
Which is what I do here. The data are from 1980 to 2021 (the last year with complete data), using the Census’s annual State & Local Government Finances dataset. The data look at aggregate spending at the “local” level, which is everything below the state level. The first tables here are just the national-level trends real total police spending, real total police spending per 100K people, and police spending as a percent of direct expenditures. If any defunding happened, it was the 2007 financial crisis that caused it.1 There was a slight dip in real spending in 2021, but an increase in percent of direct expenditures going to police–so that looks a lot more like Covid-related financial struggles than an affirmative goal to scale back the governments’ focus on policing.
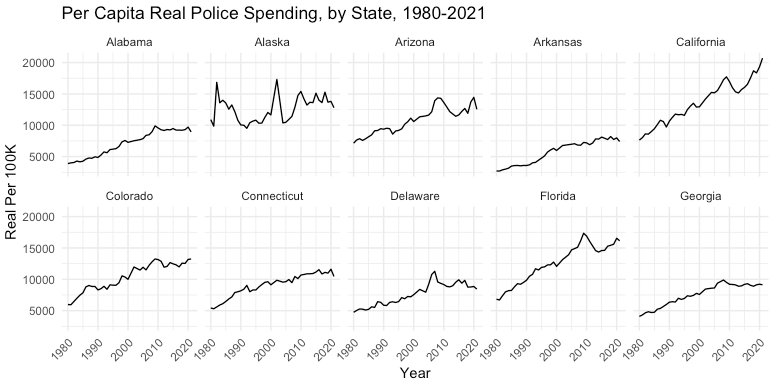
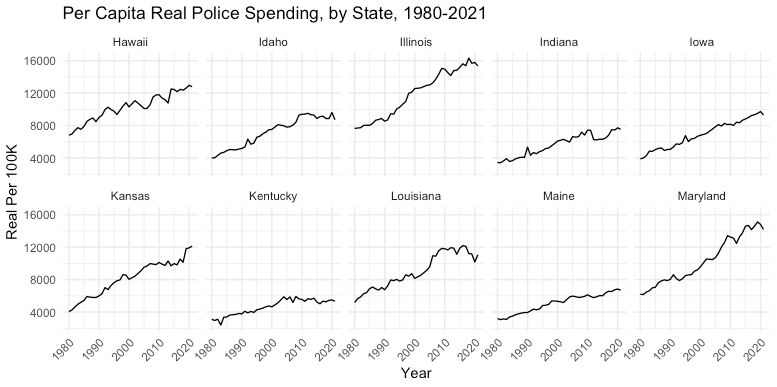
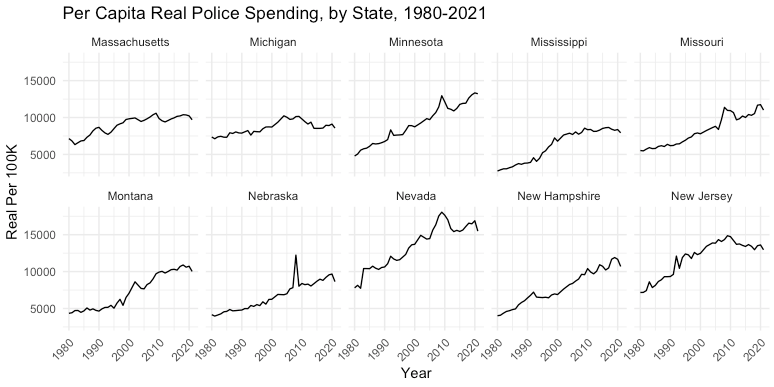
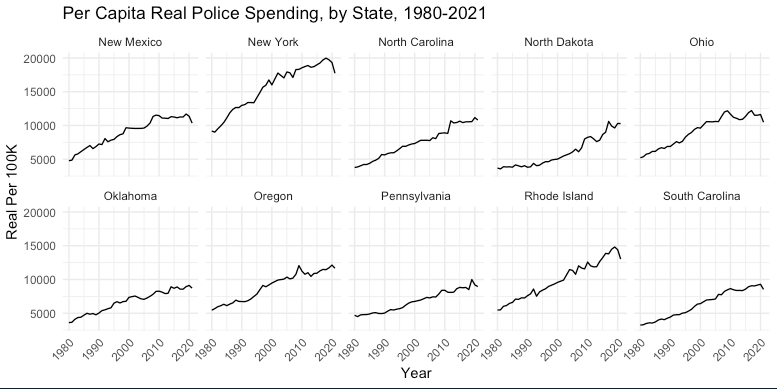
Now, of course, it’s always possible that the national aggregates mask really important state-level variations. So here’s the state-level real police spending per 100K. Not quite as smooth as the aggregate, sure, but still telling the same basic story. States seem to fall roughly into to categories: constant growth, or growth followed by a plateau. Basically no state shows any sign of even getting close to where they were in the early 1990s, when crime peaked.

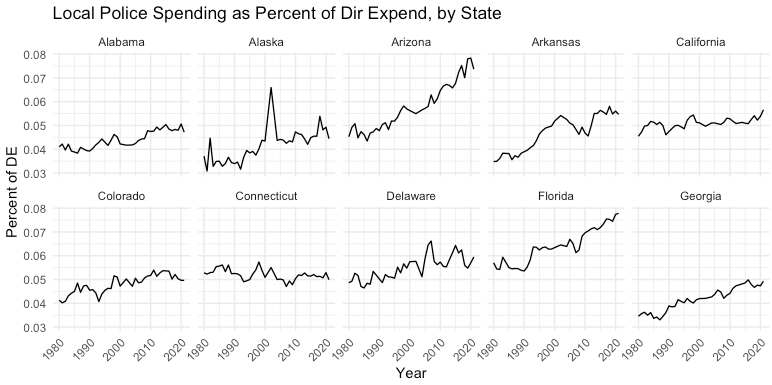
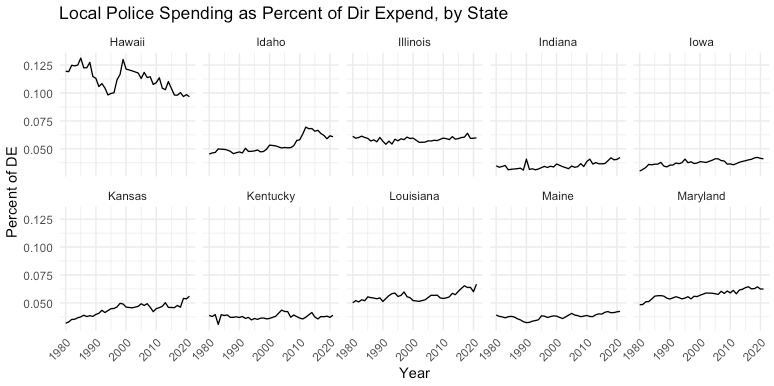
If we break out police-spending-as-a-percent-of-all-direct-expenditures, we do see that a few states are at or below where they were in the 1980s, but in those cases the declines have been long and steady … and again: these are declines in share of the budget, so it just means that the increases in actual real per-capita spending were slower than the overall growth in fiscal capacity. But even here, for most states, the increases in real per-capita spending seen above reflect the police taking up growing shares of total expenditures. And in most states, if there was any decline in 2021, it wasn’t enough to offset the growth that had come before.

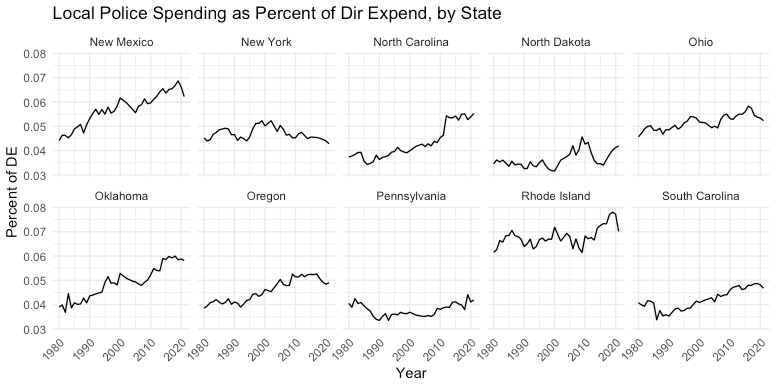
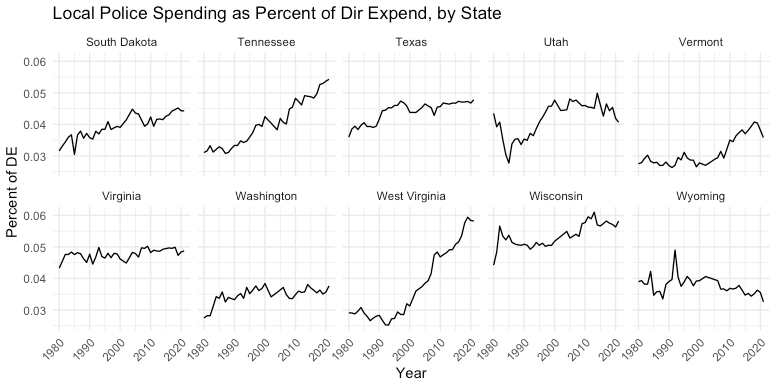
In short, defunding never happened, at least not at the aggregated-local level. Is it possible that some place saw declines? Perhaps. And the next stage of this project is to break results out at the county level, though that is slightly trickier because the Census only selects a subset of counties for 8 out of every 10 years (years ending in 2 and 7 are censuses, the rest sampled surveys). But at any sort of aggregate level, defunding simply did not occur, whatever the rhetoric or the alarmism over it.
.

