
It was obvious almost from Day 1 that Covid was going to pose a serious problem in US prisons and jails. The New York Times had an op-ed warning of the risks it posed as early as March 16, 2020, and by the end of April it was already clear that prisons (alongside meat-packing plants) were the major hotspots for the disease. In many ways, this threat provided governors and other state officials with powerful political cover to scale back the number of people behind bars. After all, prison-borne Covid posed a risk not only to the communities those in prisons returned to, but it also spread Covid to the (often more Republican-leaning) communities in which the prisons tended to be located. Democratic governors had a public-health excuse for cutting back on incarceration, and Republican governors could point to the risks facing correctional officers and their families.
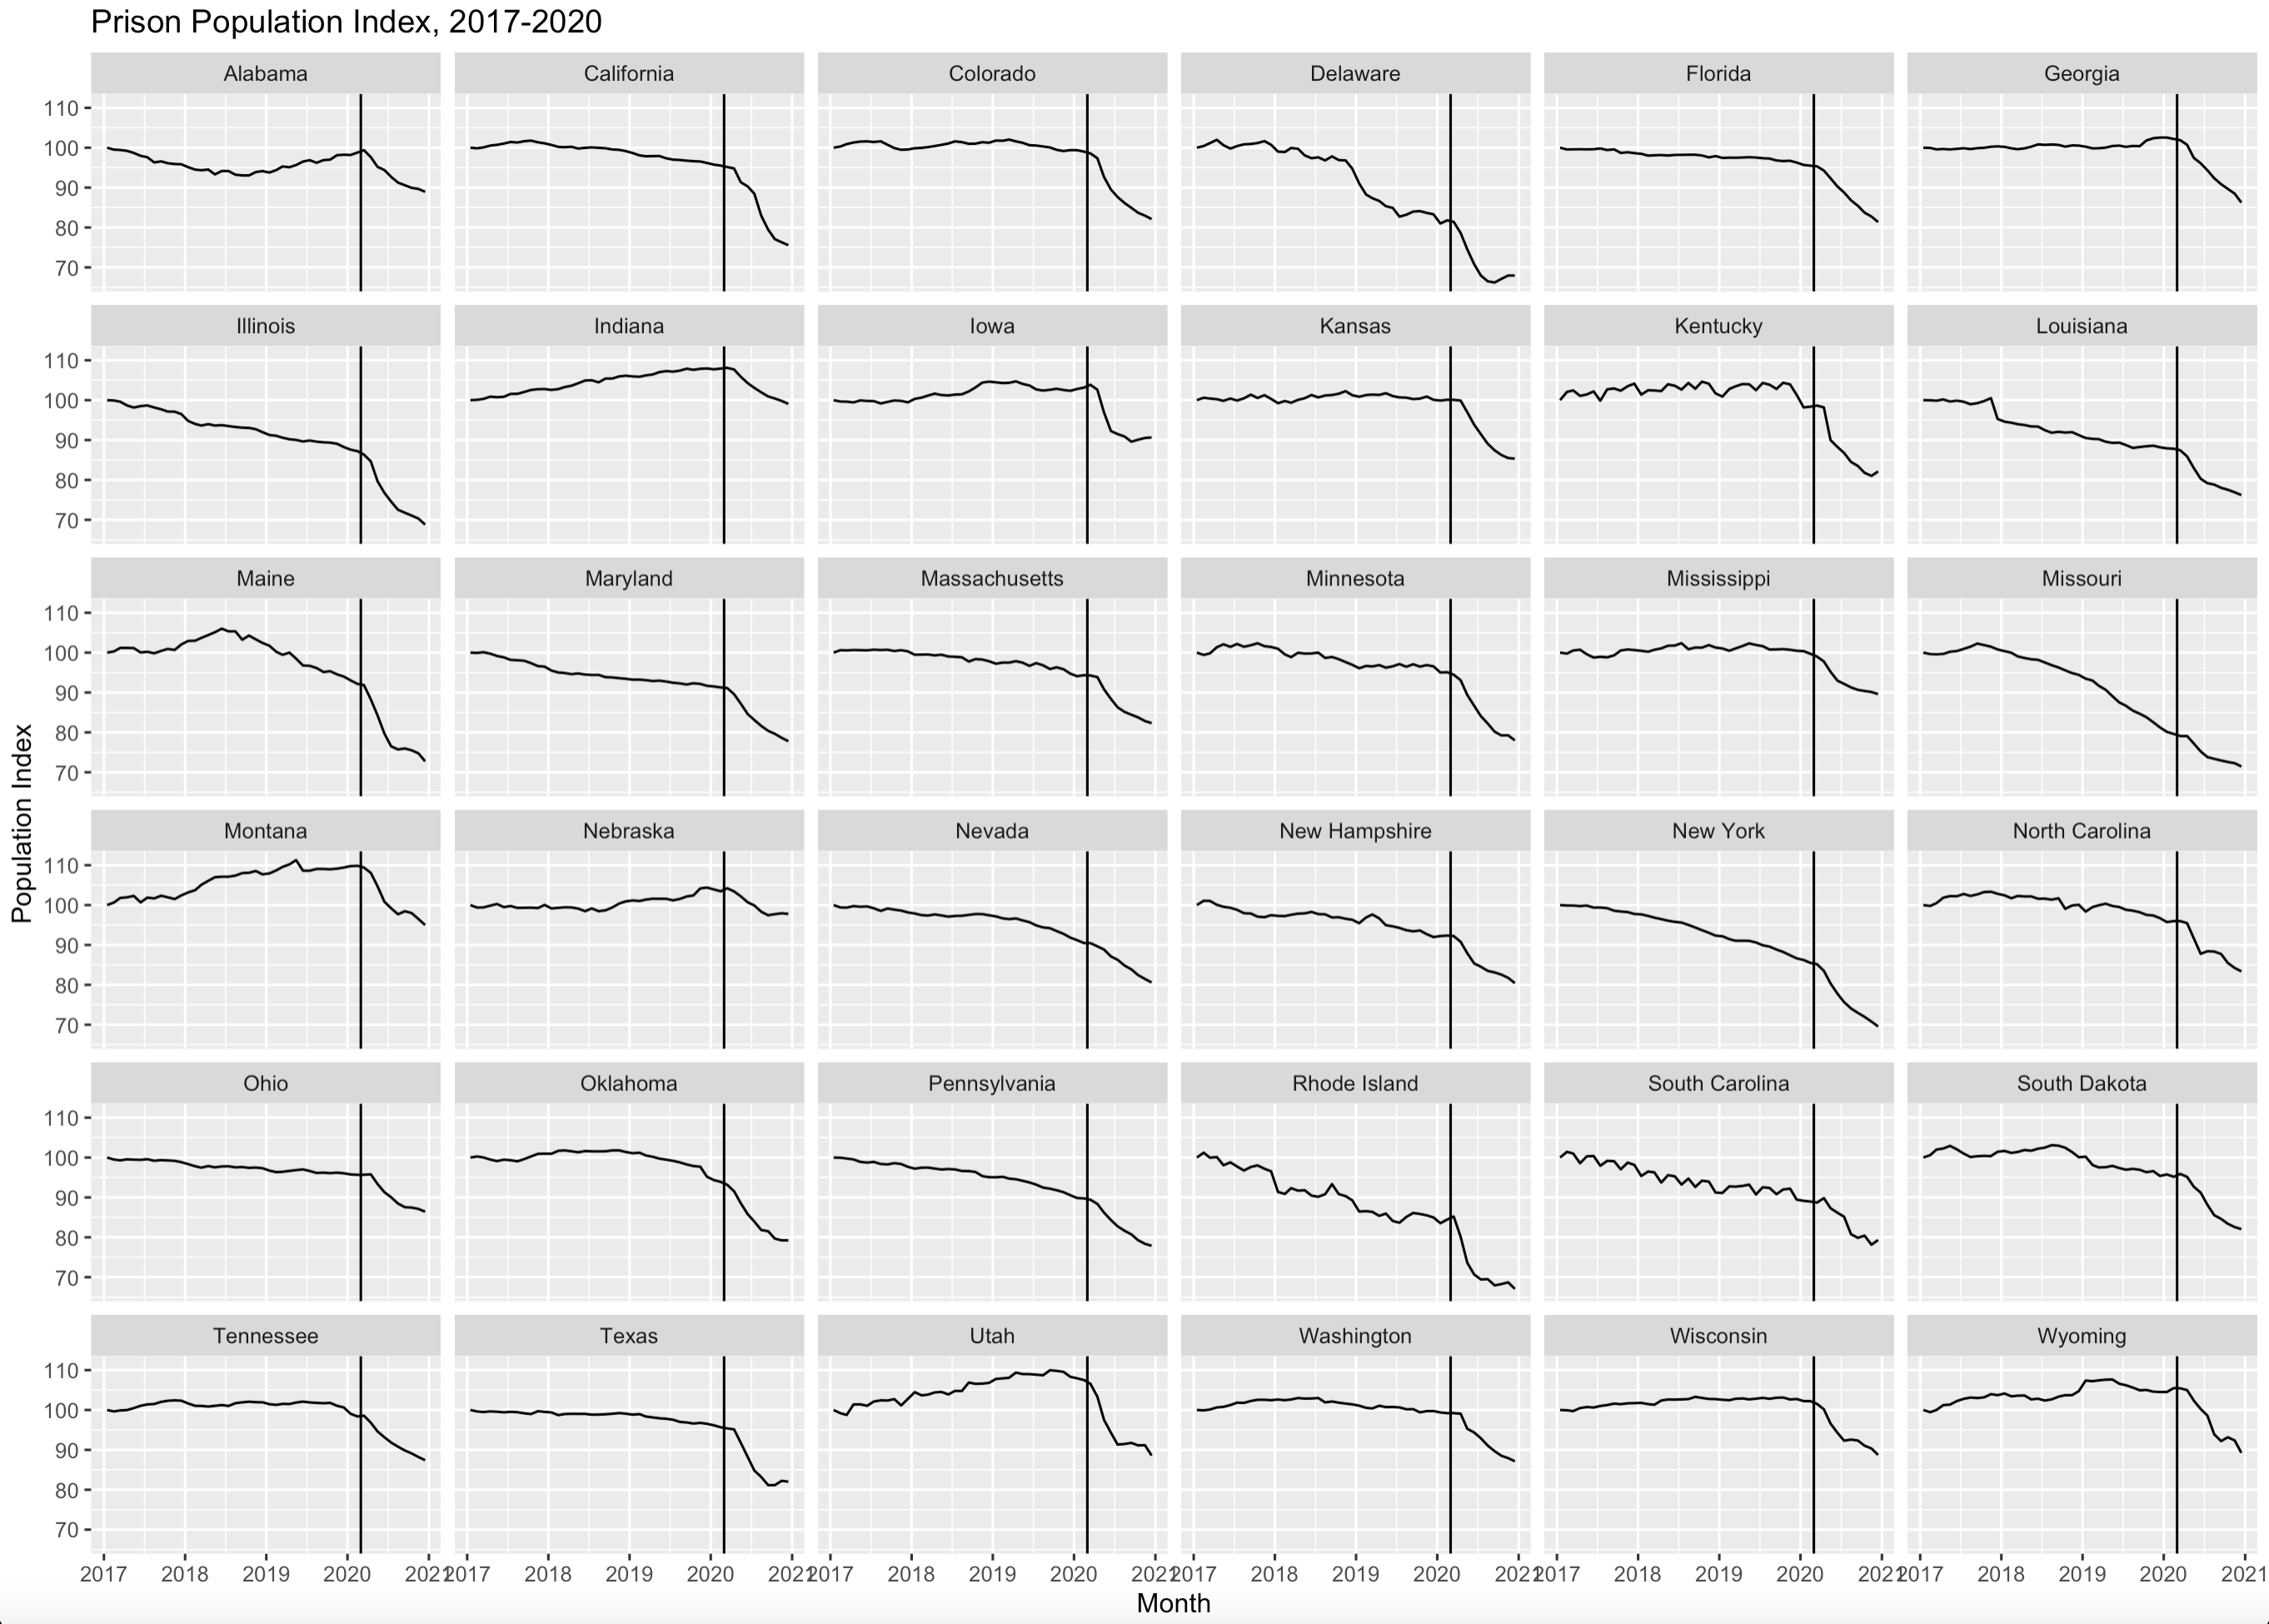
Yet the overall declines were often fairly modest at best, as is clear in the figure below, which plots monthly prison populations in 36 states from January 2017 to December 2020 (the vertical line is March 1, 2020, my proxy for the on-set of Covid). I use an index here rather than raw population counts to emphasize the percentage shifts rather than the raw changes, which can vary greatly across states with very different prison populations.1
The story here is pretty consistent. Few states cut their prison populations to anything below 80% of where they were in January 2017, and many of those with the biggest index drops by the end of 2020 had already seen steady declines, some significant, even before Covid. A huge public health threat, and a tellingly meager response.
And this graph likely overstates the degree of reduction. As the next figure shows, most of the reductions in 2020 came from reduced admissions, not releases.2 But a decline in prison admissions is not the same thing as a decline in overall admissions. In some cases, state prisons stopped accepting post-conviction transfers from local jails, which meant that a person who didn’t show up as prison admission may still have remained behind bars (in the local jail). Releases would have been “real” reductions; declining admissions may not have been, at least not entirely.

Yet, in many ways, the story is even worse than all this.
What drew me to this topic was less the issue of the overall decline in prison populations, but rather how states responded to those most at risk of serious injury or death due to Covid, especially during pre-vaccine 2020. Covid posed a particular risk to two broad populations: those with certain pre-existing medical conditions, and the elderly. Unfortunately, I lack data on the former, but I now have a lot of data on ages (at least through December 2020) to consider the latter.3
And the story that emerges when we separate out the ages is striking.
Here’s the trend in prison-population indexes for four age cohorts: those 18-39, 40-49, 50-64, and 65 and over (with January 2017 set equal to 100 for each cohort). Two related patterns stand out immediately. First, the number of people aged 65+ had been growing in most states even before Covid, and in many states had basically been the only age cohort that was growing. And second, in many states their numbers continued to grow after Covid hit; even when they shrank, their numbers rarely shrank to same degree as those for younger people.
Across almost all states, we remained the most punitive towards the most vulnerable. And towards the population that generally has the lowest risk of reoffending.

Now, an important caveat about indices, which I generally dislike but found useful here. The most obvious problem they pose is that they are vulnerable to base-rate problems. Since indices measure percent changes (an index of 110 means the value is 10% higher than the baseline value of 100), large index increases may reflect small absolute baserates.
And that is part of the issue here. As the next graph shows, those 65 and over rarely make up more than 4% to 5% of the total prison population–the lesson from the previous graph is definitely not that prison population increases are being driven by rising numbers of elderly inmates. But it’s also clear that we treated the elderly in prison in a distinctly harsh way compared to younger people held in prisons. Note, too, that the baserate issue isn’t to blame whenever the index is rising for the over-65s while falling for everyone else.

That caveat aside, what explains why the elderly were treated so harshly, even though they were among the most vulnerable? I don’t think it was intentional, targeted malice. There are two, intimately related, features that drove this. The growth in older prisoners is driven far more by people aging while in prisons rather than being admitted while old,4 and that in turn is due to the fact that most older people in prison are locked up for crimes of violence.
First, the aging point. This next graph plots the monthly admissions and releases from prisons of those aged 65 and over. The graphs are messy, because the number of older people admitted or released each month is pretty small (in many states as few as 10 or 15 per month). But across all these graphs, a clear pattern emerges: in most states, releases consistently exceed admissions, and where they don’t the gap is small and transitory. In short, the rise in the number of elderly in prison is not an admissions-driven phenomenon. The admit/release flows are pretty consistently working against rising numbers of elderly.
tl;dr: the growth in older people seen in the third graph above is due to people admitted when they were younger aging into their 60s, not being admitted in their 60s.

Why, then, are so there enough younger people aging into their 60s to offset the admit/release net declines? Because most older people in prison committed crimes of violence. Even before Covid, ~80% of the elderly in prison were there because their most recent conviction was for a crime of violence; outside of California (due to Realignment), the younger cohorts never come close to that.

In the wake of Covid, that the elderly were convicted of violence surely played a major role in why so few were released, since many of the state release policies explicitly and categorically excluded those convicted of violence. Other states may not have had a categorical ban but did require that anyone released pose little risk to public safety–which, while likely true for many of these older inmates, even those convicted of serious violent crimes years before, surely stacked the deck against them.
The political lesson here is depressing. Even with powerful political cover, governors from both parties were generally unwilling to release elderly inmates, even though their risk of reoffending was likely low, and even though they faced the greatest risk of suffering death or harm. At best (grimly), this shows how the specter of Willie Horton still haunts the politics of punishment. At worst, it lays bare how deeply committed to harshness and severity even Democratic governors are.
Neither take, however, is particularly appealing.
.
- I wrestled here with a hoary data-visualization debate, namely whether to force the y-axis here to start at zero, which would make the percent declines appear even less dramatic than they already do. I opted not to, because setting the y-axis to zero would be to think about the size of the drop against a total-abolition baseline, which seems politically fantastical, whatever the merits or lack thereof of an abolitionist goal. ↩︎
- You can ignore the bonkers pictures for Kentucky and South Carolina. It’s clear that they did not report their monthly data in a monthly way. The spikes aren’t real, but are artifacts of the states reporting data at a different rate than the BJS recorded it. Also, that spike for Louisiana in late-2017 is not an error, but a striking visual of a sentencing reform law. ↩︎
- My data here come from the National Corrections Reporting Program, which released its 2020 data (the most current available) a few months back. ↩︎
- That last sentence is me walking back–a bit, and by no means entirely–a claim I’ve made in the past, that we understate the extent to which aging prisons populations come from admitting the elderly, not younger people serving long sentences aging into being elderly. That take was fueled by a BJS report on aging in prisons which pointed out that ~50% of those over 65 in prison had served fewer than ten years–implying that about half of all those 65 and over had been admitted in the mid-50s at their earliest (see Table 3 here). I don’t think that BJS report was wrong, and I do think we understate the role of later-in-life admissions. But these results–especially the fact that admissions of those over 65 are generally less than releases, even as the number of people over 65 grows–are leading me to put more weight than I had before on the role longer sentences have played in bringing about an increasingly gray-haired prison population. ↩︎
